Hi
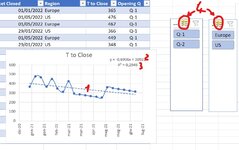
I was wondering if someone would be able to help me with a workbook chart issue. I am trying to represent open and closed dates on a chart effectively charting the trend of when something opened versus how long it took to close by month. but my excel chart doesn't seem to present that data effectively. Example Picture:
My actual Data is much larger but is restricted to my work laptop I have approx 350 rows of data to try and display in the form of a chart, with months and total of tickets. I need to lines one to represent the date open and the second to represent the date closed. The charts that I have played around with do not seem to effectively map the data in a readable way.