Chart values are showing different

Allwinv

New Member
Joined
May 19, 2019
Messages
32
Dear Excel experts,

I have a data in the below tabular format.

9:15:00​
-7.53​
9:16:00​
-11.72​
9:17:00​
-6.32​
9:18:00​
-1.38​
9:19:00​
-8.25​
9:20:00​
-3.53​
9:21:00​
1.65​
9:22:00​
-2.12​
9:23:00​
4.62​
9:24:00​
10.51​

1. As first column is time, I want to display HH:MM only. Can you please help me, how to display HH:MM format only.
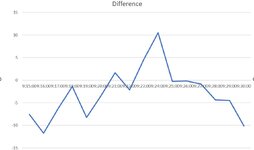
2. Please find the attached image of the chart. The X Axis text is showing in center. I want to keep text in the bottom.
 

Attachments

  • excel Chart.JPG
    excel Chart.JPG
    52.8 KB · Views: 8

Excel Facts

Remove leading & trailing spaces
Save as CSV to remove all leading and trailing spaces. It is faster than using TRIM().

Forum statistics

Threads
1,215,035
Messages
6,122,785
Members
449,095
Latest member
m_smith_solihull

We've detected that you are using an adblocker.

We have a great community of people providing Excel help here, but the hosting costs are enormous. You can help keep this site running by allowing ads on MrExcel.com.
Allow Ads at MrExcel

Which adblocker are you using?

Disable AdBlock

Follow these easy steps to disable AdBlock

1)Click on the icon in the browser’s toolbar.
2)Click on the icon in the browser’s toolbar.
2)Click on the "Pause on this site" option.
Go back

Disable AdBlock Plus

Follow these easy steps to disable AdBlock Plus

1)Click on the icon in the browser’s toolbar.
2)Click on the toggle to disable it for "mrexcel.com".
Go back

Disable uBlock Origin

Follow these easy steps to disable uBlock Origin

1)Click on the icon in the browser’s toolbar.
2)Click on the "Power" button.
3)Click on the "Refresh" button.
Go back

Disable uBlock

Follow these easy steps to disable uBlock

1)Click on the icon in the browser’s toolbar.
2)Click on the "Power" button.
3)Click on the "Refresh" button.
Go back
Back
Top