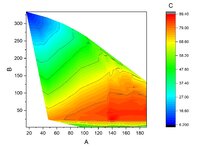
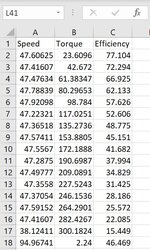
Hi, I am trying to draw a 2D contour plot in Excel. I have attached my data and the color contour I am expecting to draw (I used another software for drawing this contour: Origin). I have attached data and sample contour. TIA
-
If you would like to post, please check out the MrExcel Message Board FAQ and register here. If you forgot your password, you can reset your password.
You are using an out of date browser. It may not display this or other websites correctly.
You should upgrade or use an alternative browser.
You should upgrade or use an alternative browser.
Contour plot (Motor efficiency mapping)
- Thread starter salman101
- Start date
Excel Facts
How to create a cell-sized chart?
Tiny charts, called Sparklines, were added to Excel 2010. Look for Sparklines on the Insert tab.
Similar threads
- Replies
- 1
- Views
- 563
- Replies
- 0
- Views
- 110
- Replies
- 0
- Views
- 260
- Replies
- 2
- Views
- 294


