Creating a bar chart based on time groupings

tpaman1975

New Member
Joined
Jun 2, 2023
Messages
1
Office Version
  1. 365
Platform
  1. Windows
I am sure this might be simple for some but it is escaping me.
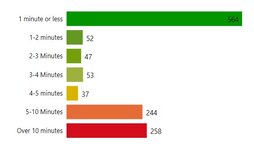
I have a column of time data formatted h:mm:ss and I would like to make a bar chart

y axis would have time groupings like:

less than a minute
1-2 minutes
2-3 minutes
3-4 minutes
4-5 minutes
5-10 minutes
Over 10 minutes

x axis would have the bar with the number fitting into that timeframe.

Any help you could give would be greatly appreciated
 

Attachments

  • Graph.jpg
    Graph.jpg
    20.6 KB · Views: 3

Excel Facts

Is there a shortcut key for strikethrough?
Ctrl+S is used for Save. Ctrl+5 is used for Strikethrough. Why Ctrl+5? When you use hashmarks to count |||| is 4, strike through to mean 5.
If you're asking how to create the data source for such a chart, the demo below should point you in the right direction.
Book1
ABCD
1ValuesRangeTotal
200:02:00Over 10 mins7
300:01:005-10 mins8
400:02:304-5 mins3
500:03:153-4 mins8
600:04:052-3 mins4
700:07:001-2 mins4
800:15:00Less than 1 min12
900:15:00
1000:02:00
1100:00:55
1200:00:55
1300:00:55
1400:00:55
1500:00:55
1600:00:55
1700:00:55
1800:00:55
1900:00:55
2000:00:55
2100:00:55
2200:00:55
2300:01:00
2400:15:00
2500:15:00
2600:15:00
2700:04:05
2800:04:05
2900:15:00
3000:02:30
3100:02:30
3200:02:30
3300:15:00
3400:03:15
3500:03:15
3600:03:15
3700:03:15
3800:03:15
3900:03:15
4000:03:15
4100:07:00
4200:07:00
4300:07:00
4400:07:00
4500:07:00
4600:07:00
4700:07:00
Sheet1
Cell Formulas
RangeFormula
D2D2=COUNTIF($A$2:$A$47,">00:10:00")
D3D3=COUNTIFS($A$2:$A$47,">00:05:00",$A$2:$A$47,"<=00:10:00")
D4D4=COUNTIFS($A$2:$A$47,">00:04:00",$A$2:$A$47,"<=00:05:00")
D5D5=COUNTIFS($A$2:$A$47,">00:03:00",$A$2:$A$47,"<=00:04:00")
D6D6=COUNTIFS($A$2:$A$47,">00:02:00",$A$2:$A$47,"<=00:03:00")
D7D7=COUNTIFS($A$2:$A$47,">=00:01:00",$A$2:$A$47,"<=00:02:00")
D8D8=COUNTIF($A$2:$A$47,"<00:01:00")


You can then use (in this demo) the range C1:D8 as your source data to create a bar graph similar to that below:

1685776438870.png
 
Upvote 0

Forum statistics

Threads
1,215,387
Messages
6,124,637
Members
449,177
Latest member
Sousanna Aristiadou

We've detected that you are using an adblocker.

We have a great community of people providing Excel help here, but the hosting costs are enormous. You can help keep this site running by allowing ads on MrExcel.com.
Allow Ads at MrExcel

Which adblocker are you using?

Disable AdBlock

Follow these easy steps to disable AdBlock

1)Click on the icon in the browser’s toolbar.
2)Click on the icon in the browser’s toolbar.
2)Click on the "Pause on this site" option.
Go back

Disable AdBlock Plus

Follow these easy steps to disable AdBlock Plus

1)Click on the icon in the browser’s toolbar.
2)Click on the toggle to disable it for "mrexcel.com".
Go back

Disable uBlock Origin

Follow these easy steps to disable uBlock Origin

1)Click on the icon in the browser’s toolbar.
2)Click on the "Power" button.
3)Click on the "Refresh" button.
Go back

Disable uBlock

Follow these easy steps to disable uBlock

1)Click on the icon in the browser’s toolbar.
2)Click on the "Power" button.
3)Click on the "Refresh" button.
Go back
Back
Top