Creating an algorithm or formula to generate a nonlinear increase in values between a specified range

ddub25

Well-known Member
Joined
Jan 11, 2007
Messages
617
Office Version
  1. 2019
Platform
  1. Windows
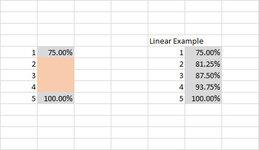
I am trying to create a table that can generate a nonlinear increase in values between 75% and 100%. I have attached a picture of my spreadsheet - the table on the left being the one that wants to generate percentage values for table rows 2,3 and 4 between 75% and 100%. The table to the right is an example of a linear increase in the percentage values (each increase in percentage is by 6.25%).

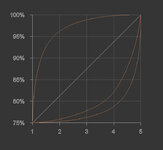
I have also attached a picture of what a graph may look like, showing nonlinear curve examples in orange as opposed to the linear line in white. I would like to be able to generate a natural, smooth curve shape of my choice by having the helper/input cells required to skew the curve in a nonlinear fashion and being able to bias the curve to fall off sharper to the end or sharper at the beginning. I want to be able to go through the process of testing different, nonlinear arcs and so will be creating a curve, testing it, creating another curve, testing it and so on.

If anyone can offer some help or point me in the right direction it would be greatly appreciated. Thanks

Dan W
 

Attachments

  • Nonlinear Values Calculator_GraphExample.jpg
    Nonlinear Values Calculator_GraphExample.jpg
    68.4 KB · Views: 38
  • Nonlinear Values Calculator_SpreadsheetPIC.jpg
    Nonlinear Values Calculator_SpreadsheetPIC.jpg
    35.1 KB · Views: 38

Excel Facts

Copy formula down without changing references
If you have =SUM(F2:F49) in F50; type Alt+' in F51 to copy =SUM(F2:F49) to F51, leaving the formula in edit mode. Change SUM to COUNT.
Take the LN or the EXP function with some stretching or shifting parameters, for example a*EXP(b*x+c)+d.
 
Upvote 0
Here is a mini sheet version of my possible solution, together with an image of the graphical output.

Cell Formulas
RangeFormula
C4:C12C4=ShiftVal+G4
D4:D12D4=ShiftVal+I4
E4:E12E4=ShiftVal+K4
G4:G12G4=OldMin*B4*OldMax/IncrDiv
H4:H12H4=B4^MyExp
I4:I12I4=H4*25/MaxExp
J4:J12J4=B4^(1/MyExp)
K4:K12K4=J4*25/MaxInvExp
Named Ranges
NameRefers ToCells
IncrDiv=Sheet1!$B$12J12, G12:H12, G4:G11
MaxExp=Sheet1!$H$12I4:I12
MaxInvExp=Sheet1!$J$12K4:K12
MyExp=Sheet1!$H$2J4:J12, H4:H12
OldMax=Sheet1!$F$12G4:G12
OldMin=Sheet1!$F$4G4:G12
ShiftVal=Sheet1!$A$4C4:E12

Linear_vs_NonLinear.png
 
Upvote 0
Thanks for the responses and yes, I thought it would be an interesting challenge. Stephen, I have tried to copy your table into Excel, but the formulas return #NAME? for me. Do I need an add in for excel for these formulas to work?
 
Upvote 0
For example, this formula,

=OldMin*B4*OldMax/IncrDiv

returns #NAME? when copied into my spreadsheet. Do I need an add in for excel for these formulas to work?
 
Upvote 0
I suspect you really need the original Excel spreadsheet, which handles names and formulae in the standard Excel manner. This can be downloaded from the link below.

Linear vs nonLinear increments

The chart above is not symmetrical about the straight line. You will get closer to symmetry around 2 axes (along the straight line and perpendicular to it) the the closer the exponent gets to the value of around 1.42. However the symmetry is not demonstrably explicit.
 
Upvote 0
Thanks Stephen - yes of course, they are Named Ranges and thanks for your help so far - it is greatly appreciated.

I have been playing around with the formulas, trying to get my head round how it works and have copied the table down and tried to enter different min and max values from which to generate nonlinear numbers between (as you can see in the Mini Sheet attached). I've tried to generate numbers between 76 (B22) and 86 (B26), but realised that this is not going to work considering the way the table has been designed to work. Is there a way to adapt the table so that it can generate numbers between random values that I enter? The numbers that I may want to enter will always be between 0 and 100.

Linear_vs_NonLinear.xlsx
ABCDEFGHIJKLMNOPQRSTU
1Linear and non-linear incrementing between 75% and 100%
25Change the exponent value here.
3LinearGeoInvGeo10Lim25InvExpLim25
4750757575100000
5178.12575.0007691.493853.12510.000763116.49385
6281.2575.0244193.946466.25320.0244141.14869818.94646
7384.37575.1853995.54699.3752430.1853941.24573120.5469
8487.575.7812596.7637612.510240.781251.31950821.76376
9590.62577.3841997.7570515.62531252.3841861.3797322.75705
10693.7580.9326298.6021918.7577765.9326171.43096923.60219
11796.87587.8227299.3411821.8751680712.822721.47577324.34118
121008100100100252532768251.51571725
13
14Data feed to Graphical output.
15
16
17
18
19
205Change the exponent value here.
21LinearGeoInvGeo10Lim25InvExpLim25
22400760767676100000
2350018276956.2510.024414118.94646
24600289779812.5320.781251.14869821.76376
257003958210018.752435.9326171.24573123.60219
2680086410110110125251024251.31950825
27
28Data feed to Graphical output.
29
30
31
32
33
34
35
Sheet1
Cell Formulas
RangeFormula
D4:D12D4=ShiftVal+H4
E4:E12E4=ShiftVal+J4
F4:F12F4=ShiftVal+L4
H4:H12H4=OldMin*C4*OldMax/IncrDiv
I4:I12I4=C4^MyExp
J4:J12J4=I4*25/MaxExp
K4:K12K4=C4^(1/MyExp)
L4:L12L4=K4*25/MaxInvExp
D22:D26D22=ShiftVal_B+H22
E22:E26E22=ShiftVal_B+J22
F22:F26F22=ShiftVal_B+L22
H22:H26H22=OldMin_B*C22*OldMax_B/IncrDiv_B
I22:I26I22=C22^MyExp_B
J22:J26J22=I22*25/MaxExp_B
K22:K26K22=C22^(1/MyExp_B)
L22:L26L22=K22*25/MaxInvExp_B
Named Ranges
NameRefers ToCells
IncrDiv=Sheet1!$C$12K12, H12:I12, H4:H11
IncrDiv_B=Sheet1!$C$26K26, H26:I26, H22:H25
MaxExp=Sheet1!$I$12J4:J12
MaxExp_B=Sheet1!$I$26J22:J26
MaxInvExp=Sheet1!$K$12L4:L12
MaxInvExp_B=Sheet1!$K$26L22:L26
MyExp=Sheet1!$I$2K4:K12, I4:I12
MyExp_B=Sheet1!$I$20K22:K26, I22:I26
OldMax=Sheet1!$G$12H4:H12
OldMax_B=Sheet1!$G$26H22:H26
OldMin=Sheet1!$G$4H4:H12
OldMin_B=Sheet1!$G$22H22:H26
ShiftVal=Sheet1!$B$4D4:F12
ShiftVal_B=Sheet1!$B$22D22:F26
 
Upvote 0
In principle, you should be able to make those changes using the current Excel model. (I guess, from your response, that you have downloaded it.)

The model works by calculating the increments from 1 to a number stipulated by you. Then it shifts those increments to the point that you want in the range 1 to 100.

In my original model select the cell 'OldMax' (F12) and change it to 10 (ie 86 - 76). The select the cell 'ShiftVal' (A4) and change it to 76.

However, you should note the that model of the percentage points outside the range you have stipulated is NOT included.
 
Upvote 0

Forum statistics

Threads
1,215,491
Messages
6,125,098
Members
449,205
Latest member
ralemanygarcia

We've detected that you are using an adblocker.

We have a great community of people providing Excel help here, but the hosting costs are enormous. You can help keep this site running by allowing ads on MrExcel.com.
Allow Ads at MrExcel

Which adblocker are you using?

Disable AdBlock

Follow these easy steps to disable AdBlock

1)Click on the icon in the browser’s toolbar.
2)Click on the icon in the browser’s toolbar.
2)Click on the "Pause on this site" option.
Go back

Disable AdBlock Plus

Follow these easy steps to disable AdBlock Plus

1)Click on the icon in the browser’s toolbar.
2)Click on the toggle to disable it for "mrexcel.com".
Go back

Disable uBlock Origin

Follow these easy steps to disable uBlock Origin

1)Click on the icon in the browser’s toolbar.
2)Click on the "Power" button.
3)Click on the "Refresh" button.
Go back

Disable uBlock

Follow these easy steps to disable uBlock

1)Click on the icon in the browser’s toolbar.
2)Click on the "Power" button.
3)Click on the "Refresh" button.
Go back
Back
Top