Hi Everyone,
I am trying to build a consultancy dashboard from an unstructured form of data to structure, to simplify the process.
The formula is
=COUNTIFS(Today Date Range, Start Date Criteria, Today Date Range, End Date Criteria, Status Column Range, Status List Criteria, Employer Column Range, Employer List Criteria, Employee Column Range, Employee List Criteria, Job Title Column Range, Job Title Criteria, Company Column Range, Company Cell Criteria, Location Column Range, Location Cell Criteria, Recruiter Column Range, Recruiter Cell Criteria)
I am trying to link to any chart suitable for the data.
If possible, go through the data to understand how I am trying to relate columns to easily analyze the data as per criteria.
Thank You.....
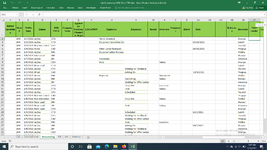