Excel Chart - Dynamic Axis

felix_k

New Member
Joined
Sep 15, 2023
Messages
1
Office Version
  1. 365
Platform
  1. Windows
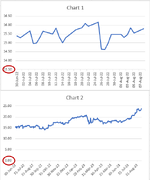
I create two simple line charts in excel - one with a shorter data range - where the chart shows an "dynamic" y-axis based on underlying data set. However, if I expand the data range of the very same chart, the y-axis starts with ZERO - although there is no value in the data range that gets even close to this value. Does anybody have an idea why this is working like this and how I can get an "dynamic" axis also with a larger data range? thanks for any useful hint - much appreciated!
 

Attachments

  • Screenshot 2023-09-15 093555.png
    Screenshot 2023-09-15 093555.png
    35.8 KB · Views: 21

Excel Facts

Can Excel fill bagel flavors?
You can teach Excel a new custom list. Type the list in cells, File, Options, Advanced, Edit Custom Lists, Import, OK

Forum statistics

Threads
1,215,077
Messages
6,122,991
Members
449,094
Latest member
masterms

We've detected that you are using an adblocker.

We have a great community of people providing Excel help here, but the hosting costs are enormous. You can help keep this site running by allowing ads on MrExcel.com.
Allow Ads at MrExcel

Which adblocker are you using?

Disable AdBlock

Follow these easy steps to disable AdBlock

1)Click on the icon in the browser’s toolbar.
2)Click on the icon in the browser’s toolbar.
2)Click on the "Pause on this site" option.
Go back

Disable AdBlock Plus

Follow these easy steps to disable AdBlock Plus

1)Click on the icon in the browser’s toolbar.
2)Click on the toggle to disable it for "mrexcel.com".
Go back

Disable uBlock Origin

Follow these easy steps to disable uBlock Origin

1)Click on the icon in the browser’s toolbar.
2)Click on the "Power" button.
3)Click on the "Refresh" button.
Go back

Disable uBlock

Follow these easy steps to disable uBlock

1)Click on the icon in the browser’s toolbar.
2)Click on the "Power" button.
3)Click on the "Refresh" button.
Go back
Back
Top