TreeSqueak
New Member
- Joined
- Sep 4, 2019
- Messages
- 5
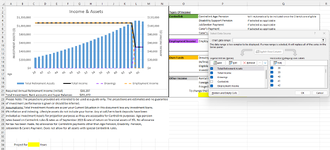
so I have an excel workbook we use in a lot of letters that I created some time ago. It has up to 8 different Legend Entries, and just the one Horizontal label.
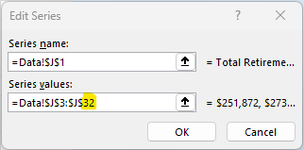
If we want to extend the chart for someone who is younger so that it reaches their life expectancy, I have to go in to each one and modify the final number. (see pic A)
Is there any way to have that final number (32 in the example pic) refer to a number i can type into a cell? so that I can have them all refer to a single cell.
so i can extend or reduce all the series' by modifying that one cell. (see bottom of chart picture for what i where that would be)
this workbook is embedded in a word document so I cannot use VBA (or macros) because they tend to glitch out.
(I used to have buttons to turn each series on and off but the macros decided to stop working after a while as it wasnt worth fixing.)