CrazyAMonkey
New Member
- Joined
- Nov 3, 2009
- Messages
- 19
Hello again all, i have a new and annoying problem.
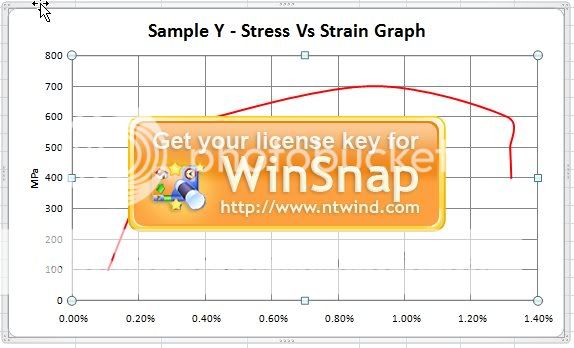
I have created a scatter graph to compare 2 sets of values. On Y i have stress and on the X i have strain (irrelevant i know, just setting the scene") )
)
my info table is thus,
<table style="border-collapse: collapse; width: 308pt;" width="409" border="0" cellpadding="0" cellspacing="0"><col style="width: 53pt;" width="70"> <col style="width: 98pt;" width="130"> <col style="width: 81pt;" width="108"> <col style="width: 76pt;" width="101"> <tbody><tr style="height: 16.5pt;" height="22"> <td colspan="2" class="xl71" style="border-right: 1pt solid black; height: 16.5pt; width: 151pt;" width="200" height="22">Test Data For Sample Y</td> <td colspan="2" class="xl71" style="border-right: 1pt solid black; border-left: medium none; width: 157pt;" width="209">Results For Sample Y</td> </tr> <tr style="height: 19.5pt;" height="26"> <td class="xl68" style="height: 19.5pt; width: 53pt;" width="70" height="26">Load (N)</td> <td class="xl69" style="width: 98pt;" width="130">Extension (mm)</td> <td class="xl69" style="width: 81pt;" width="108">Stress (N/m<sup>2</sup>)</td> <td class="xl69" style="width: 76pt;" width="101">Strain</td> </tr> <tr style="height: 16.5pt;" height="22"> <td class="xl66" style="height: 16.5pt; width: 53pt;" width="70" height="22">2000</td> <td class="xl67" style="width: 98pt;" width="130">0.6</td> <td class="xl70" style="width: 81pt;" width="108">100.00E+6</td> <td class="xl70" style="width: 76pt;" width="101">1.09E-3</td> </tr> <tr style="height: 16.5pt;" height="22"> <td class="xl66" style="height: 16.5pt; width: 53pt;" width="70" height="22">4000</td> <td class="xl67" style="width: 98pt;" width="130">0.8</td> <td class="xl70" style="width: 81pt;" width="108">200.00E+6</td> <td class="xl70" style="width: 76pt;" width="101">1.45E-3</td> </tr> <tr style="height: 16.5pt;" height="22"> <td class="xl66" style="height: 16.5pt; width: 53pt;" width="70" height="22">6000</td> <td class="xl67" style="width: 98pt;" width="130">1</td> <td class="xl70" style="width: 81pt;" width="108">300.00E+6</td> <td class="xl70" style="width: 76pt;" width="101">1.82E-3</td> </tr> <tr style="height: 16.5pt;" height="22"> <td class="xl66" style="height: 16.5pt; width: 53pt;" width="70" height="22">8000</td> <td class="xl67" style="width: 98pt;" width="130">1.18</td> <td class="xl70" style="width: 81pt;" width="108">400.00E+6</td> <td class="xl70" style="width: 76pt;" width="101">2.15E-3</td> </tr> <tr style="height: 16.5pt;" height="22"> <td class="xl66" style="height: 16.5pt; width: 53pt;" width="70" height="22">9400</td> <td class="xl67" style="width: 98pt;" width="130">1.3</td> <td class="xl70" style="width: 81pt;" width="108">470.00E+6</td> <td class="xl70" style="width: 76pt;" width="101">2.36E-3</td> </tr> <tr style="height: 16.5pt;" height="22"> <td class="xl66" style="height: 16.5pt; width: 53pt;" width="70" height="22">9200</td> <td class="xl67" style="width: 98pt;" width="130">1.5</td> <td class="xl70" style="width: 81pt;" width="108">460.00E+6</td> <td class="xl70" style="width: 76pt;" width="101">2.73E-3</td> </tr> <tr style="height: 16.5pt;" height="22"> <td class="xl66" style="height: 16.5pt; width: 53pt;" width="70" height="22">9200</td> <td class="xl67" style="width: 98pt;" width="130">1.6</td> <td class="xl70" style="width: 81pt;" width="108">460.00E+6</td> <td class="xl70" style="width: 76pt;" width="101">2.91E-3</td> </tr> <tr style="height: 16.5pt;" height="22"> <td class="xl66" style="height: 16.5pt; width: 53pt;" width="70" height="22">10000</td> <td class="xl67" style="width: 98pt;" width="130">1.75</td> <td class="xl70" style="width: 81pt;" width="108">500.00E+6</td> <td class="xl70" style="width: 76pt;" width="101">3.18E-3</td> </tr> <tr style="height: 16.5pt;" height="22"> <td class="xl66" style="height: 16.5pt; width: 53pt;" width="70" height="22">11000</td> <td class="xl67" style="width: 98pt;" width="130">2.1</td> <td class="xl70" style="width: 81pt;" width="108">550.00E+6</td> <td class="xl70" style="width: 76pt;" width="101">3.82E-3</td> </tr> <tr style="height: 16.5pt;" height="22"> <td class="xl66" style="height: 16.5pt; width: 53pt;" width="70" height="22">12000</td> <td class="xl67" style="width: 98pt;" width="130">2.4</td> <td class="xl70" style="width: 81pt;" width="108">600.00E+6</td> <td class="xl70" style="width: 76pt;" width="101">4.36E-3</td> </tr> <tr style="height: 16.5pt;" height="22"> <td class="xl66" style="height: 16.5pt; width: 53pt;" width="70" height="22">14000</td> <td class="xl67" style="width: 98pt;" width="130">5</td> <td class="xl70" style="width: 81pt;" width="108">700.00E+6</td> <td class="xl70" style="width: 76pt;" width="101">9.09E-3</td> </tr> <tr style="height: 16.5pt;" height="22"> <td class="xl66" style="height: 16.5pt; width: 53pt;" width="70" height="22">12000</td> <td class="xl67" style="width: 98pt;" width="130">7.2</td> <td class="xl70" style="width: 81pt;" width="108">600.00E+6</td> <td class="xl70" style="width: 76pt;" width="101">13.09E-3</td> </tr> <tr style="height: 16.5pt;" height="22"> <td class="xl66" style="height: 16.5pt; width: 53pt;" width="70" height="22">10000</td> <td class="xl67" style="width: 98pt;" width="130">7.25</td> <td class="xl70" style="width: 81pt;" width="108">500.00E+6</td> <td class="xl70" style="width: 76pt;" width="101">13.18E-3</td> </tr> <tr style="height: 16.5pt;" height="22"> <td class="xl66" style="height: 16.5pt; width: 53pt;" width="70" height="22">8000</td> <td class="xl67" style="width: 98pt;" width="130">7.27</td> <td class="xl70" style="width: 81pt;" width="108">400.00E+6</td> <td class="xl70" style="width: 76pt;" width="101">13.22E-3
</td> </tr> </tbody></table>
As you can see the values of strain are ever increasing, however whenever i make the graph of stress Vs strain i get a negative going tail for the last two values (i.e. graph is saying strain is decreasing).
I can not understand what is happening with it?!
I know this has to be a quick fix and my error, please someone put me out of my misery!!
I have created a scatter graph to compare 2 sets of values. On Y i have stress and on the X i have strain (irrelevant i know, just setting the scene
)my info table is thus,
<table style="border-collapse: collapse; width: 308pt;" width="409" border="0" cellpadding="0" cellspacing="0"><col style="width: 53pt;" width="70"> <col style="width: 98pt;" width="130"> <col style="width: 81pt;" width="108"> <col style="width: 76pt;" width="101"> <tbody><tr style="height: 16.5pt;" height="22"> <td colspan="2" class="xl71" style="border-right: 1pt solid black; height: 16.5pt; width: 151pt;" width="200" height="22">Test Data For Sample Y</td> <td colspan="2" class="xl71" style="border-right: 1pt solid black; border-left: medium none; width: 157pt;" width="209">Results For Sample Y</td> </tr> <tr style="height: 19.5pt;" height="26"> <td class="xl68" style="height: 19.5pt; width: 53pt;" width="70" height="26">Load (N)</td> <td class="xl69" style="width: 98pt;" width="130">Extension (mm)</td> <td class="xl69" style="width: 81pt;" width="108">Stress (N/m<sup>2</sup>)</td> <td class="xl69" style="width: 76pt;" width="101">Strain</td> </tr> <tr style="height: 16.5pt;" height="22"> <td class="xl66" style="height: 16.5pt; width: 53pt;" width="70" height="22">2000</td> <td class="xl67" style="width: 98pt;" width="130">0.6</td> <td class="xl70" style="width: 81pt;" width="108">100.00E+6</td> <td class="xl70" style="width: 76pt;" width="101">1.09E-3</td> </tr> <tr style="height: 16.5pt;" height="22"> <td class="xl66" style="height: 16.5pt; width: 53pt;" width="70" height="22">4000</td> <td class="xl67" style="width: 98pt;" width="130">0.8</td> <td class="xl70" style="width: 81pt;" width="108">200.00E+6</td> <td class="xl70" style="width: 76pt;" width="101">1.45E-3</td> </tr> <tr style="height: 16.5pt;" height="22"> <td class="xl66" style="height: 16.5pt; width: 53pt;" width="70" height="22">6000</td> <td class="xl67" style="width: 98pt;" width="130">1</td> <td class="xl70" style="width: 81pt;" width="108">300.00E+6</td> <td class="xl70" style="width: 76pt;" width="101">1.82E-3</td> </tr> <tr style="height: 16.5pt;" height="22"> <td class="xl66" style="height: 16.5pt; width: 53pt;" width="70" height="22">8000</td> <td class="xl67" style="width: 98pt;" width="130">1.18</td> <td class="xl70" style="width: 81pt;" width="108">400.00E+6</td> <td class="xl70" style="width: 76pt;" width="101">2.15E-3</td> </tr> <tr style="height: 16.5pt;" height="22"> <td class="xl66" style="height: 16.5pt; width: 53pt;" width="70" height="22">9400</td> <td class="xl67" style="width: 98pt;" width="130">1.3</td> <td class="xl70" style="width: 81pt;" width="108">470.00E+6</td> <td class="xl70" style="width: 76pt;" width="101">2.36E-3</td> </tr> <tr style="height: 16.5pt;" height="22"> <td class="xl66" style="height: 16.5pt; width: 53pt;" width="70" height="22">9200</td> <td class="xl67" style="width: 98pt;" width="130">1.5</td> <td class="xl70" style="width: 81pt;" width="108">460.00E+6</td> <td class="xl70" style="width: 76pt;" width="101">2.73E-3</td> </tr> <tr style="height: 16.5pt;" height="22"> <td class="xl66" style="height: 16.5pt; width: 53pt;" width="70" height="22">9200</td> <td class="xl67" style="width: 98pt;" width="130">1.6</td> <td class="xl70" style="width: 81pt;" width="108">460.00E+6</td> <td class="xl70" style="width: 76pt;" width="101">2.91E-3</td> </tr> <tr style="height: 16.5pt;" height="22"> <td class="xl66" style="height: 16.5pt; width: 53pt;" width="70" height="22">10000</td> <td class="xl67" style="width: 98pt;" width="130">1.75</td> <td class="xl70" style="width: 81pt;" width="108">500.00E+6</td> <td class="xl70" style="width: 76pt;" width="101">3.18E-3</td> </tr> <tr style="height: 16.5pt;" height="22"> <td class="xl66" style="height: 16.5pt; width: 53pt;" width="70" height="22">11000</td> <td class="xl67" style="width: 98pt;" width="130">2.1</td> <td class="xl70" style="width: 81pt;" width="108">550.00E+6</td> <td class="xl70" style="width: 76pt;" width="101">3.82E-3</td> </tr> <tr style="height: 16.5pt;" height="22"> <td class="xl66" style="height: 16.5pt; width: 53pt;" width="70" height="22">12000</td> <td class="xl67" style="width: 98pt;" width="130">2.4</td> <td class="xl70" style="width: 81pt;" width="108">600.00E+6</td> <td class="xl70" style="width: 76pt;" width="101">4.36E-3</td> </tr> <tr style="height: 16.5pt;" height="22"> <td class="xl66" style="height: 16.5pt; width: 53pt;" width="70" height="22">14000</td> <td class="xl67" style="width: 98pt;" width="130">5</td> <td class="xl70" style="width: 81pt;" width="108">700.00E+6</td> <td class="xl70" style="width: 76pt;" width="101">9.09E-3</td> </tr> <tr style="height: 16.5pt;" height="22"> <td class="xl66" style="height: 16.5pt; width: 53pt;" width="70" height="22">12000</td> <td class="xl67" style="width: 98pt;" width="130">7.2</td> <td class="xl70" style="width: 81pt;" width="108">600.00E+6</td> <td class="xl70" style="width: 76pt;" width="101">13.09E-3</td> </tr> <tr style="height: 16.5pt;" height="22"> <td class="xl66" style="height: 16.5pt; width: 53pt;" width="70" height="22">10000</td> <td class="xl67" style="width: 98pt;" width="130">7.25</td> <td class="xl70" style="width: 81pt;" width="108">500.00E+6</td> <td class="xl70" style="width: 76pt;" width="101">13.18E-3</td> </tr> <tr style="height: 16.5pt;" height="22"> <td class="xl66" style="height: 16.5pt; width: 53pt;" width="70" height="22">8000</td> <td class="xl67" style="width: 98pt;" width="130">7.27</td> <td class="xl70" style="width: 81pt;" width="108">400.00E+6</td> <td class="xl70" style="width: 76pt;" width="101">13.22E-3
</td> </tr> </tbody></table>
As you can see the values of strain are ever increasing, however whenever i make the graph of stress Vs strain i get a negative going tail for the last two values (i.e. graph is saying strain is decreasing).
I can not understand what is happening with it?!
I know this has to be a quick fix and my error, please someone put me out of my misery!!