Formula to find trend line zero crossing point?

fixit9660

New Member
Joined
May 2, 2014
Messages
10
Office Version
  1. 2010
Platform
  1. Windows
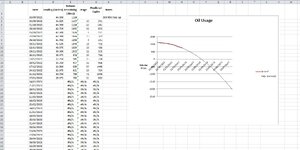
I'm using a Polynomial Trendline to predict when my heating oil supply will run out. I'm using the Polynomial trendline because it's the one which best matches the consumption curve.
It works well but I was wondering if I could expand the detail of the oil exhaustion date a little, maybe the actual predicted date. (I'm not after the millisecond prediction time! LOL).
I found this previous posting Formula to find trend line zero crossing point? but I can't understand how to use LINEST to do what I want.
 

Attachments

  • Oil Usage 1.JPG
    Oil Usage 1.JPG
    184.3 KB · Views: 19

Excel Facts

Is there a shortcut key for strikethrough?
Ctrl+S is used for Save. Ctrl+5 is used for Strikethrough. Why Ctrl+5? When you use hashmarks to count |||| is 4, strike through to mean 5.
To use LINEST to find the x-intercept of your trendline, you will need to have your data in two columns in an Excel spreadsheet: one column for the x-values and one column for the y-values. Then, follow these steps:

  1. Select the two columns of data.
  2. On the Data tab of the ribbon, click the "Data Analysis" button.
  3. In the Data Analysis window, select "LINEST" from the list of functions and click "OK."
  4. In the LINEST window, make sure that the "Labels in first row" and "Labels in first column" boxes are checked, and then click "OK."
  5. Excel will insert a new sheet in the workbook with the statistical results of the LINEST function.
  6. In the first row of the results sheet, you will see the slope and y-intercept of the trendline. The x-intercept is the point at which the trendline crosses the x-axis, so it is equal to -y-intercept/slope.
For example, if the slope is 3 and the y-intercept is 2, the x-intercept would be (-2)/3 = -0.67. This means that the trendline crosses the x-axis at x = -0.67.
 
Upvote 0
Hello. Thanks for the promt response, much appreciated.
I couldn't find the "Data Analysis" button under the "Data" Tab until I went through File > Options > Add-Ins, etc and installed it. I now have the "Data Analysis" button but no dropdown option for LINEST?
 
Upvote 0
I've tried entering the equation =LINEST(E2:E18,C2:C18) manually but it rejects the "#N/A" data. It only works on the entered data, and gives me a date of 08/12/2317 (once I'd realised what the 152649.3 was and configured the Cell in Date mode) which might be unreasonable.
 
Upvote 0
It sounds like you may not have the LINEST function installed in your version of Excel. To check if it is available in your version of Excel, you can try the following steps:

  1. Click on the "Formulas" tab in the ribbon.
  2. In the "Formulas" tab, click on the "Insert Function" button (it looks like fx).
  3. In the "Insert Function" window, type "LINEST" in the search box and press enter.
  4. If the LINEST function appears in the search results, it is available in your version of Excel. If it does not appear, it is not available in your version of Excel.
If the LINEST function is not available in your version of Excel, there are other ways you can find the x-intercept of a trendline. One option is to use the slope and y-intercept of the trendline to manually calculate the x-intercept. To do this, you can use the following formula: x-intercept = -y-intercept/slope.

Alternatively, you can use a different function or method to find the x-intercept of the trendline. Some options might include using the SLOPE and INTERCEPT functions, or using the TREND function to create a trendline and then using the FORECAST function to find the x-intercept.
LINEST is there.
 
Upvote 0

Forum statistics

Threads
1,215,059
Messages
6,122,918
Members
449,094
Latest member
teemeren

We've detected that you are using an adblocker.

We have a great community of people providing Excel help here, but the hosting costs are enormous. You can help keep this site running by allowing ads on MrExcel.com.
Allow Ads at MrExcel

Which adblocker are you using?

Disable AdBlock

Follow these easy steps to disable AdBlock

1)Click on the icon in the browser’s toolbar.
2)Click on the icon in the browser’s toolbar.
2)Click on the "Pause on this site" option.
Go back

Disable AdBlock Plus

Follow these easy steps to disable AdBlock Plus

1)Click on the icon in the browser’s toolbar.
2)Click on the toggle to disable it for "mrexcel.com".
Go back

Disable uBlock Origin

Follow these easy steps to disable uBlock Origin

1)Click on the icon in the browser’s toolbar.
2)Click on the "Power" button.
3)Click on the "Refresh" button.
Go back

Disable uBlock

Follow these easy steps to disable uBlock

1)Click on the icon in the browser’s toolbar.
2)Click on the "Power" button.
3)Click on the "Refresh" button.
Go back
Back
Top