Gannt Chart Mechanics

ExcelRoy

Well-known Member
Joined
Oct 2, 2006
Messages
2,540
Office Version
  1. 365
Platform
  1. Windows
Hi all,

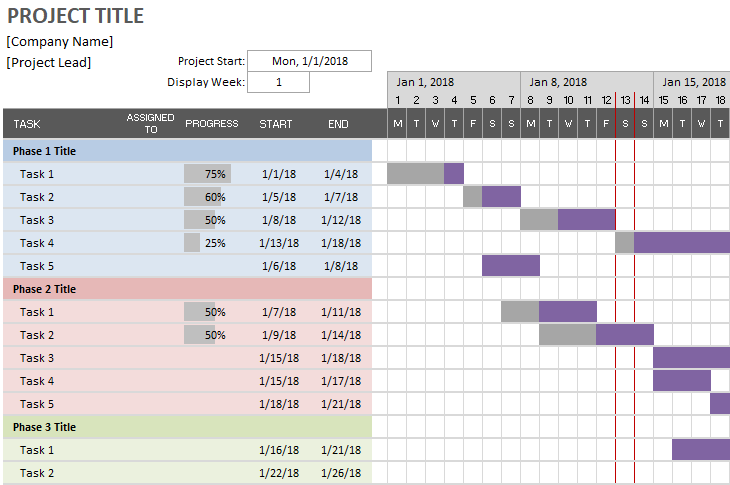
Can anyone help with understanding how the "Display Week" works in the following Gannt Chart

tf16400962_win322

This is from

When you enter the week the visable dates begin from that week automatically

Any help would be appreciated

Thanks
 

Excel Facts

Quick Sum
Select a range of cells. The total appears in bottom right of Excel screen. Right-click total to add Max, Min, Count, Average.
Watching the linked YouTube video seemed pretty straight forward. What part are you unable to understand?
 
Upvote 0

Forum statistics

Threads
1,215,078
Messages
6,122,997
Members
449,093
Latest member
masterms

We've detected that you are using an adblocker.

We have a great community of people providing Excel help here, but the hosting costs are enormous. You can help keep this site running by allowing ads on MrExcel.com.
Allow Ads at MrExcel

Which adblocker are you using?

Disable AdBlock

Follow these easy steps to disable AdBlock

1)Click on the icon in the browser’s toolbar.
2)Click on the icon in the browser’s toolbar.
2)Click on the "Pause on this site" option.
Go back

Disable AdBlock Plus

Follow these easy steps to disable AdBlock Plus

1)Click on the icon in the browser’s toolbar.
2)Click on the toggle to disable it for "mrexcel.com".
Go back

Disable uBlock Origin

Follow these easy steps to disable uBlock Origin

1)Click on the icon in the browser’s toolbar.
2)Click on the "Power" button.
3)Click on the "Refresh" button.
Go back

Disable uBlock

Follow these easy steps to disable uBlock

1)Click on the icon in the browser’s toolbar.
2)Click on the "Power" button.
3)Click on the "Refresh" button.
Go back
Back
Top