Hello forum users,
I am a Power Pivot beginner and I created the following data model:
Contained in the following Excel: Example excel file
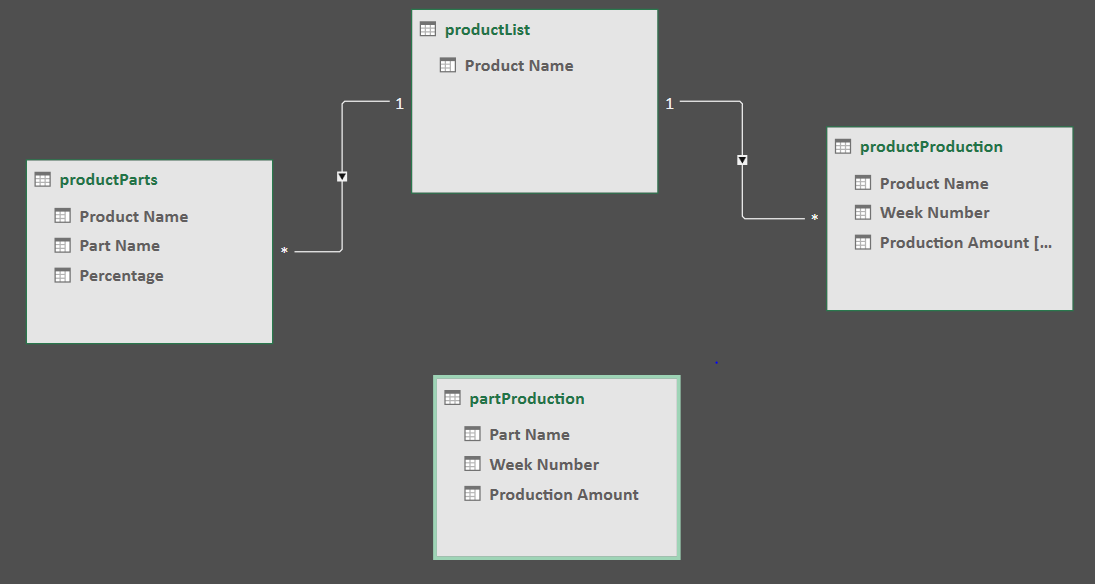
The tables productParts, productList and productProduction contain data. Now I am trying to create the partProduction table that contains for each weeknumber the production amount. The weekly part production amount equals the part product percentage (from productParts) times the corresponding weekly product production from table product Production. I tried a few DAX functions for generating the columns in partProduction but I cannot get it to work. Any ideas on how to approach this problem?
I am a Power Pivot beginner and I created the following data model:
Contained in the following Excel: Example excel file
The tables productParts, productList and productProduction contain data. Now I am trying to create the partProduction table that contains for each weeknumber the production amount. The weekly part production amount equals the part product percentage (from productParts) times the corresponding weekly product production from table product Production. I tried a few DAX functions for generating the columns in partProduction but I cannot get it to work. Any ideas on how to approach this problem?


