Hi all,
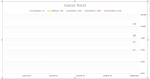
Having some issues getting a graph to plot data points. I currently have this graph working on an older version of this form so I'm not sure what's going on. Img1 shows my table which is formula driven. Only the first column (I) of data is populating the graph as shown in Img2. The proceeding numbers are registering as 0's and aren't plotting, however my date along the X axis is. Img3 shows my data selection.
I initially just tried to build the graph from scratch but it gave me this issue. I then copy and pasted the old graph into this file, and refined the formula to not reference the old sheet, but had the same outcome. Any help is much appreciated!