Control Chart Graph conflicting with data points

Jacked0528

New Member
Joined
Mar 30, 2021
Messages
11
Office Version
  1. 2016
Platform
  1. Windows
Good Afternoon All,

I created a dynamic control chart from a video assist a number of months ago and the dynamic chart in and of itself works great. The only issue is the chart is designed to be used when there's an Upper and Lower Spec as well as an Upper and Lower Control limit. Once you start pulling any of those 4 data points away it gets weird. There's plenty of times when I won't have all 4 criteria defined so I need the graph to work and work well if even only 1 is populated. I'll try and upload the mini-sheet this evening after trying to download the L2BB extension but I suppose to get my initial thoughts out I'll upload images/issues I'm struggling with (maybe the pictures will help when the formulas are available anyways).

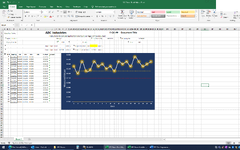
Issue 1: No matter what configuration of blanks, zeroes, etc. I use, if all 4 data points aren't listed (USL, LSL, UCL, LCL) the remainder hang out at 0.0000 on the graph.

Image 1 - There's only a lower control limit but on the graph all data points are flagged as control limit violations (Formula says it's greater than the UCL so it's a violation but telling it to ignore blanks, zeroes, etc. just throw error messages)
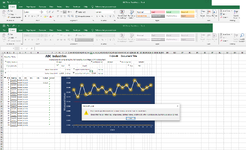
Image 2 - Once I apply "-" to Upper Control Limit I get the reference error message (note it didn't give me the message when I had the "-" in the Upper Spec Limit (image1))

There may be a few others but I'll start with those as some of the fix opportunities could fix the others.
 

Attachments

  • Image1.png
    Image1.png
    196.1 KB · Views: 7
  • Image2.png
    Image2.png
    157.7 KB · Views: 6

Excel Facts

Last used cell?
Press Ctrl+End to move to what Excel thinks is the last used cell.
While waiting for the xl2bb data, this may help:
For all the places where you have blanks, what happens if you put =NA() function as result of the calculation in those "" (or blank) cells? (this works in on line charts by not putting a line between the two points on either side (or just one side if it is the first or last of the series).
 
Upvote 0
If you don't care about an (USL, LSL, UCL, LCL), may be just enter a bogus number for the missing value, so you won't get an out of spec. Another other option may be to have Excel calculate the missing value(s) from the data entered. Doesn't your customer have LSL and USL they want you to meet?
 
Upvote 0
When I try uploading the mini sheet it doesn't bring the graph even though it's inside the selected cell range. How can I incorporate that into this, or is that not necessary at this point?
 
Upvote 0
If you don't care about an (USL, LSL, UCL, LCL), may be just enter a bogus number for the missing value, so you won't get an out of spec. Another other option may be to have Excel calculate the missing value(s) from the data entered. Doesn't your customer have LSL and USL they want you to meet?
I'd like the form to be robust enough to capture data when only minimum or maximum data points are required which sometimes is a requirement. As a last resort I could have the UCL/LCL match the USL/LSL but that doesn't work in all variations so I was hoping to have everyone here peer into the workings to see if each individually can work successfully before creating a bunch of exceptions (to only have USL you need to do x, y and z to have it work, etc.).
 
Upvote 0
When I try uploading the mini sheet it doesn't bring the graph even though it's inside the selected cell range. How can I incorporate that into this, or is that not necessary at this point?
xl2bb doesn't copy chart objects (in my experience) on the sheets. So, an image of the chart is okay. But, for the forum to really help you we should get your data that builds the chart.
 
Upvote 0
Let's give this one a shot. I deleted the data points for measurements 21-100 but they plot on the graph no different than 1-20.

SPC Form_Variable_Min Only Example.xlsx
ABCDEFGHIJVWXYZAAABACADAEAFAGAHAIAJAKALAMANAOAPAQARASAT
31NomenclatureWidget2Lot/Batch No.ABC123
4
5Characteristic3.0104Depth
6
77Upper Spec Limit-inches9Upper Control Limitinches
8
98Lower Spec Limit0.0100inches10Lower Control Limit0.0130inches
10
1116UnitReadingLSLLCLUCLUSLCL AlertSL AlertUnitReadingUnitReadingUnitReadingUnitReading
1210.01500.01000.01300.0000 0.0150#N/A21416181
1320.01200.01000.01300.0000 0.0120#N/A22426282
1430.01700.01000.01300.0000 0.0170#N/A23436383
1540.01300.01000.01300.0000 0.0130#N/A24446484
1650.01350.01000.01300.0000 0.0135#N/A25456585
1760.01700.01000.01300.0000 0.0170#N/A26466686
1870.01500.01000.01300.0000 0.0150#N/A27476787
1980.01600.01000.01300.0000 0.0160#N/A28486888
2090.01400.01000.01300.0000 0.0140#N/A29496989
21100.01500.01000.01300.0000 0.0150#N/A30507090
22110.01300.01000.01300.0000 0.0130#N/A31517191
23120.01700.01000.01300.0000 0.0170#N/A32527292
24130.01600.01000.01300.0000 0.0160#N/A33537393
25140.01700.01000.01300.0000 0.0170#N/A34547494
26150.01500.01000.01300.0000 0.0150#N/A35557595
27160.01900.01000.01300.0000 0.0190#N/A36567696
28170.01700.01000.01300.0000 0.0170#N/A37577797
29180.01500.01000.01300.0000 0.0150#N/A38587898
30190.01600.01000.01300.0000 0.0160#N/A39597999
31200.01700.01000.01300.0000 0.0170#N/A406080100
Sheet 1
Cell Formulas
RangeFormula
AL7AL7=Y7
Y9Y9=Y7
AL9AL9=Y7
E12:E31E12=IF(OR(D12="",$W$9="-"),"",$W$9)
F12:F31F12=IF(OR(D12="",$AI$9="-"),"",$AI$9)
G12:G31G12=IF(OR(D12="",$AI$7="-"),"",$AI$7)
H12:H31H12=IF(OR(D12="",$W$7="-"),"",$W$7)
I12:I31I12=IF(AND(ISERROR(J12),OR(D12<F12,D12>G12)),D12,#N/A)
J12:J31J12=IF(OR(D12<E12,D12>H12),D12,#N/A)
Named Ranges
NameRefers ToCells
'Sheet 1'!LCL=OFFSET('Sheet 1'!$F$12,,,COUNT('Sheet 1'!$G$12:$G$111))I12
'Sheet 1'!LSL=OFFSET('Sheet 1'!$E$12,,,COUNT('Sheet 1'!$G$12:$G$111))J12
'Sheet 1'!Reading=OFFSET('Sheet 1'!$D$12,,,COUNT('Sheet 1'!$G$12:$G$111))E12:J12
'Sheet 1'!SLAlert=OFFSET('Sheet 1'!$J$12,,,COUNT('Sheet 1'!$G$12:$G$111))I12
'Sheet 1'!UCL=OFFSET('Sheet 1'!$G$12,,,COUNT('Sheet 1'!$G$12:$G$111))I12
'Sheet 1'!USL=OFFSET('Sheet 1'!$H$12,,,COUNT('Sheet 1'!$G$12:$G$111))J12
Cells with Conditional Formatting
CellConditionCell FormatStop If True
AV12:AW22,Y12:Y31,AE12:AE31,AK12:AK31,AQ12:AQ31,BD19:BD20,AV23,AV24:AW111,AB32:AB111,AH32:AH111,AN32:AN111,AT32:AT111,AJ112,AP112,AU112,AD112:AD113,AX112:AX113,H113:I113,D12:F112Cellcontains a blank value textYES
D12Expression=$D$12=0textNO
D12:D112,Y12:Y31,AE12:AE31,AK12:AK31,AQ12:AS31Expression=(D12>$W$9)*AND($W$7="-")textYES
E1:AJ1,W9Cellcontains a blank value textNO
AN3:AT3Cellcontains a blank value textNO
Y12:Y31,AE12:AE31,AK12:AK31,AQ12:AS31,D12:D112Expression=(D12<$W$7)*AND($W$9="-")textYES
G3:AH3,BA3:BH3,BB5:BE5,BD10:BF10Cellcontains a blank value textNO
W7Cellcontains a blank value textNO
AA5Cellcontains a blank value textNO
AI7:AK7,AI9:AK9Cellcontains a blank value textNO
W5,BD9,BB114Cellcontains a blank value textNO
D12:D31,Y12:AA31,AE12:AG31,AK12:AM31,AQ12:AS31Expression=$W$9="-"textYES
Y12:Y31,AE12:AE31,AK12:AK31,AQ12:AS31,D12:D112Cell Value<$W$9textNO
D12:D31,Y12:AA31,AE12:AG31,AK12:AM31,AQ12:AS31Expression=$W$7="-"textYES
Y12:Y31,AE12:AE31,AK12:AK31,AQ12:AS31,D12:D112Cell Value>$W$7textNO
Cells with Data Validation
CellAllowCriteria
Y7List=$Q$172:$Q$173
 
Upvote 0
Here is a screenshot of the graph represented by the mini sheet above.
 

Attachments

  • Graph Screenshot.png
    Graph Screenshot.png
    126.1 KB · Views: 4
Upvote 0

Forum statistics

Threads
1,215,073
Messages
6,122,970
Members
449,095
Latest member
Mr Hughes

We've detected that you are using an adblocker.

We have a great community of people providing Excel help here, but the hosting costs are enormous. You can help keep this site running by allowing ads on MrExcel.com.
Allow Ads at MrExcel

Which adblocker are you using?

Disable AdBlock

Follow these easy steps to disable AdBlock

1)Click on the icon in the browser’s toolbar.
2)Click on the icon in the browser’s toolbar.
2)Click on the "Pause on this site" option.
Go back

Disable AdBlock Plus

Follow these easy steps to disable AdBlock Plus

1)Click on the icon in the browser’s toolbar.
2)Click on the toggle to disable it for "mrexcel.com".
Go back

Disable uBlock Origin

Follow these easy steps to disable uBlock Origin

1)Click on the icon in the browser’s toolbar.
2)Click on the "Power" button.
3)Click on the "Refresh" button.
Go back

Disable uBlock

Follow these easy steps to disable uBlock

1)Click on the icon in the browser’s toolbar.
2)Click on the "Power" button.
3)Click on the "Refresh" button.
Go back
Back
Top