SandsB
Well-known Member
- Joined
- Feb 13, 2007
- Messages
- 705
- Office Version
- 365
- Platform
- Windows
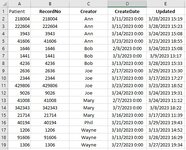
My data file has about 50 rows of data - varies each day. Could also be over a 100 or less than 10. The range of dates could be a few weeks to several months. Table 1 attached.
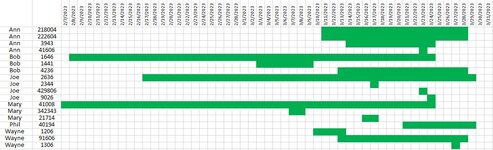
Somehow, I need to get this data displayed in a graphical format (Chart2 attached) - could be a chart, could be cells with background color like the attached. The graph needs to show the dates from the Create date to the Update date. EX: In row 1 the report was created on 3/11 and updated on 3/28 so those dates and everything in between is color coded. I can't use M$ Project or any other tool - just Excel. Could be formulas or VBA.
Somehow, I need to get this data displayed in a graphical format (Chart2 attached) - could be a chart, could be cells with background color like the attached. The graph needs to show the dates from the Create date to the Update date. EX: In row 1 the report was created on 3/11 and updated on 3/28 so those dates and everything in between is color coded. I can't use M$ Project or any other tool - just Excel. Could be formulas or VBA.