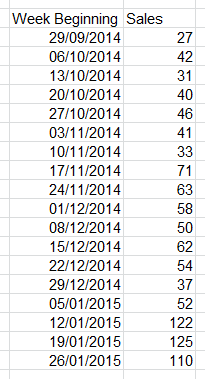
I have data which I want to display on an Excel column chart. It represents the number of sales per week, where the date is the first day of the week:
If I leave the dates as dates then Excel interprets this as data for one day out of seven, so I get thin columns with large gaps:

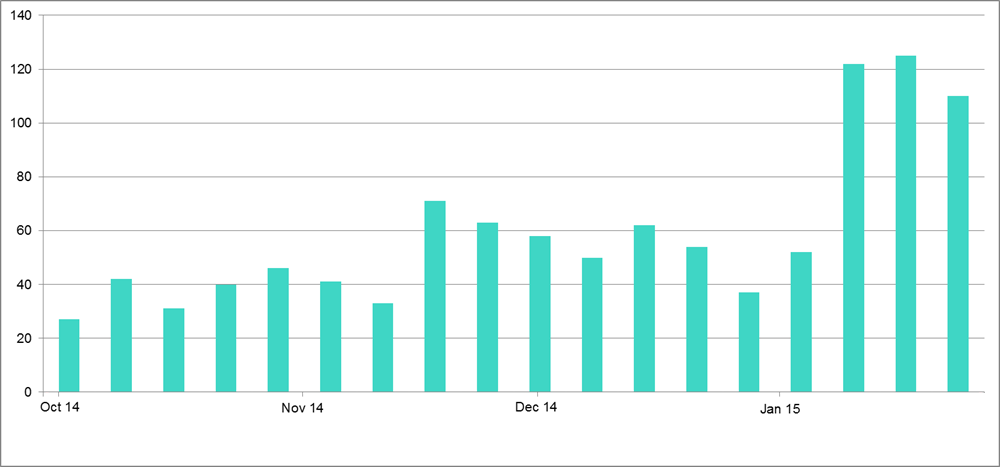
I can resolve this by formatting the dates as text, which gives me the style I want:

However, I want a date scale where only the first of each month is labelled, which I think requires a date formatted axis.
Basically, I want to achieve this in Excel instead of paint:
Any ideas on how (if) this can be done?
If I leave the dates as dates then Excel interprets this as data for one day out of seven, so I get thin columns with large gaps:
I can resolve this by formatting the dates as text, which gives me the style I want:
However, I want a date scale where only the first of each month is labelled, which I think requires a date formatted axis.
Basically, I want to achieve this in Excel instead of paint:
Any ideas on how (if) this can be done?


