heat map

BrandonAlexander

New Member
Joined
Jul 25, 2021
Messages
4
Office Version
  1. 2007
Platform
  1. Windows
Inventory Location Heat Mapping

Hello all,

I am trying to develop a heat map using conditional formatting representing the activity of bin locations in our warehouse. I have drawn out the locations with each cell representing one location on sheet 1. I am importing data from our system that represents the number of times we have had to visit specific locations to pull inventory and pasted that into sheet 2. I now need to match a location on sheet one to the location on sheet 2 and use the activity data on sheet 2 to color code the cell on sheet 1.

Example: Sheet one contains location 04-01-001, Find location 04-01-001 on sheet 2 and we have gone to that location 300 times this year. 300 would represent a highly active location which should format the cell on sheet one in red.

Any thoughts or ideas would be greatly appreciated. I have a very basic knowledge of formulas in excel.

Thanks
 

Excel Facts

Highlight Duplicates
Home, Conditional Formatting, Highlight Cells, Duplicate records, OK to add pink formatting to any duplicates in selected range.
Without more info....
How about a VlOOKUP in the Bin cells on Sheet1 to lookup the value on sheet2, then use either CF or a VBA to color the cells based on a range of values, ie, <10, <50,<100....etc
 
Upvote 0
Thank you for the reply Michael. That is definitely what I am trying to achieve. I attempted to use vlookup to find the matches between sheets but am a little unclear how to instruct excel to use the value associated with the match on sheet 2 to determine color value in the conditional formatting. I am using excel 2007 and have read that referencing other sheets for conditional formatting was not introduced until later versions.
 
Upvote 0
Well, as suggested, use the VLOOKUP to populate the bins on Sheet1. Once a bin has a number in it we can write a macro to colour the bins.
Are you OK with writing a VLOOKUP....If not we would need to see the data structure on sheets 1 & 2
If you have quite a few bins and a number of variables for the visits, I wouldn't think CF would be suitable.
If you desensitize the data you could upload your workbook to a hosting site, DropBox for instance, then post the link to it back here.....someone could then take a more detailed look into it !!
 
Upvote 0
Thank you again Michael,

Here is an image of sheet 1
Location Set.JPG
I would like to retain the location labels rather than replace them with the number of pulls on sheet 1. I am looking to use the number of pulls to dictate what color to assign to the cell

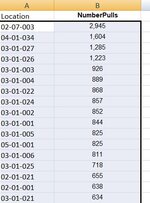
Here is the data from sheet 2
Location Set 2.JPG

Ideally the outcome would look something like this
Location Set 3.JPG

Red indicating high activity, Green being low activity and yellow somewhere in between.

I hope this helps.

Thank you again
 
Upvote 0
If there only 3 ranges that are going to be involved maybe CF will work, but If you are going to post screenshots instead of real data (which we can't work with)
I'd suggest having a look here and following the step by step, to using a VLOOKUP in the CF condition.
 
Upvote 0
Solution
Hi Brandon,

You can used conditional formatting to set the min, mid, and max values for your colorized heat map.

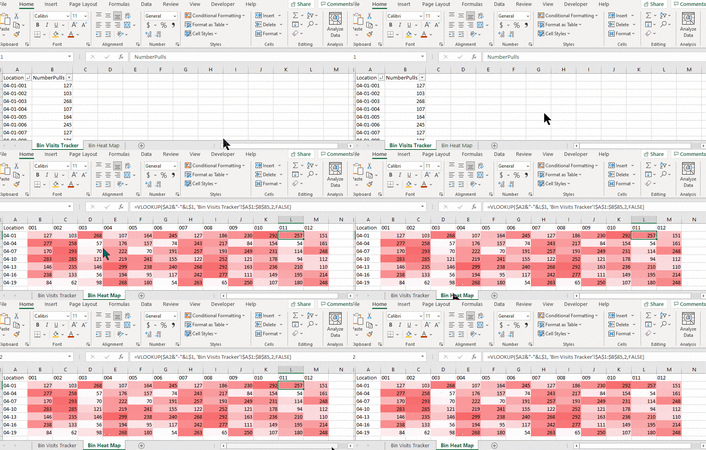
Here's a possible solution:

As you have a pretty easy numbering system, I suggest that you take the first section of the location (e.g. "04-01") and keep only unique values. Use those as row labels. In the example above, that breaks you locations down to eight rows. Then, take the last three numbers of your location (e.g. "001") and convert those to column headers. Then, you can do a pretty simple VLOOKUP like so:

=VLOOKUP($A2&"-"&B$1, 'Bin Visits Tracker'!$A$1:$B$85,2,FALSE)

Next, you can quickly choose the conditional formatting you prefer using the Color Scales option. It will automatically figure out you min/max/mid values and color them accordingly.

And, if you only want to see colors and not the values, you can set the font formatting to Custom and use the custom code ";;;" to make the numbers "Disappear". (Home > Font Pane > Font Settings > Number > Custom)
 

Attachments

  • BinLocationHeatMap.gif
    BinLocationHeatMap.gif
    64 KB · Views: 28
Upvote 0

Forum statistics

Threads
1,215,054
Messages
6,122,897
Members
449,097
Latest member
dbomb1414

We've detected that you are using an adblocker.

We have a great community of people providing Excel help here, but the hosting costs are enormous. You can help keep this site running by allowing ads on MrExcel.com.
Allow Ads at MrExcel

Which adblocker are you using?

Disable AdBlock

Follow these easy steps to disable AdBlock

1)Click on the icon in the browser’s toolbar.
2)Click on the icon in the browser’s toolbar.
2)Click on the "Pause on this site" option.
Go back

Disable AdBlock Plus

Follow these easy steps to disable AdBlock Plus

1)Click on the icon in the browser’s toolbar.
2)Click on the toggle to disable it for "mrexcel.com".
Go back

Disable uBlock Origin

Follow these easy steps to disable uBlock Origin

1)Click on the icon in the browser’s toolbar.
2)Click on the "Power" button.
3)Click on the "Refresh" button.
Go back

Disable uBlock

Follow these easy steps to disable uBlock

1)Click on the icon in the browser’s toolbar.
2)Click on the "Power" button.
3)Click on the "Refresh" button.
Go back
Back
Top