Help selecting variable range for cut and paste

knittelmail

New Member
Joined
Jun 28, 2023
Messages
13
Office Version
  1. 365
Platform
  1. Windows
I am trying to automate/speed up the process of combining information from two worksheets. Sheet A is a report generated by software. Sheet B is filled with formulas that I want to use on the information in Sheet A. As background, I think Sheet A was created by the devil. It has multiple ranges of merged cells, it has loads of wrapped text, and cells that look empty but have space characters in them. The row heights are also set at a standard row height that hides some of the text in the wrapped cells. I can fix all of that, but...

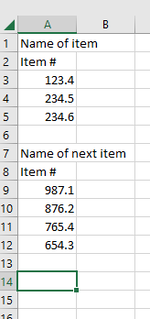
What I am having trouble with is the variable row location of the ranges I want to select. There are several ranges in Sheet A. They don't always start or end in the same place. The number of columns across is always the same, but the number of rows in each row can change. This means I can't do a straight copy and paste. For example:

The range including A1 might have 3 rows or it might have 10. The number of rows in the first range changes the starting location of the next range and so on down the column. Please pretend that column C is a new instance of column A
1689180669832.png

Sheet A or Sheet B can be modified so that the rows line up, but I have to do it manually each time. Running a module would be a lot easier and faster.
My thinking is that on Sheet A, I can count the number of occupied cells between the empty cells then subtract that number from a set number of rows in Sheet B (say 20) and insert that number of rows to make everything line up for relatively simple cut and paste.
Can anyone point me in the right direction?
Thank you all very much!
 

Attachments

  • 1689180106112.png
    1689180106112.png
    6.8 KB · Views: 6
OaklandJim, you are so right about merged cells. I think they were invented to make everything more difficult.

My apologies. Sometime I just muddy the waters giving too much information in my attempt to explain. This is a beast and I truly appreciate the help.
I will try to break things down.

1 - the original pictures are meant to illustrate that the sections in the report I receive do not always have the same number of rows in each section. They do not relate to the actual sheets. It is probably best to ignore them.

2 - I will resend hopefully better examples of each step when I get back to work on Monday.

3 - The process is currently a lot of steps to get to my desired outcome. I will do my best to break it down
a - I run a report and save it to my computer. This report is the one in the worksheet called "Original"
b - The second thing is to work on the formatting of the report so that it can be worked on without lots of profanity.
All that happens here is that I unmerge the whole sheet and unwrap text on the whole sheet.
That is what I was trying to show in the worksheet "After Cleanup". It is probably best to ignore this bad example too.
c - I then move to the sheet called Formulas1. I created this sheet myself. It has lots of formulas in it and some colored cells.

My goal at this point is to copy the information I want in "Report" and paste it into "Formual1 without overwriting any of the formulas. And have the pasted data line up correctly with the colored cells.
Right now I have to do this manually small section by small section.

I have to mention that there is second report that I run that I get information off of to put into the sheet called Formulas1. This report only prints in PDF so no cutting and pasting. I have to get the numbers I need and manually enter them into the appropriate spot in the Formulas1 sheet. The yellow cells in Formulas1 are where I enter the numbers from the second report and the formulas depend on what I enter. Right now it is not important to me that the formulas work. I can fix them when "Report" and "Formula1" are combined.

d - The sheet called "Finished Product" is what it should look like when all is said and done. You can ignore the numbers in any column right of "O". I will send an empty example.

Thank you again.

Please let me know what else I can do to help.
 
Upvote 0

Excel Facts

Why are there 1,048,576 rows in Excel?
The Excel team increased the size of the grid in 2007. There are 2^20 rows and 2^14 columns for a total of 17 billion cells.
So the initial report you receive -- worksheet named Original -- has three sections, each with a variable number of rows?

I created a macro that formats that worksheet so the merged cells are removed and so various other formatting is accomplished without your intervention. When done Original looks like this...

Sample ver2.xlsm
ABCDEFGHIJKLM
1Thursday, May 25, 2023
2CREATE
3Recipe #Recipe NamePortion SizeUtensilHACCPPrep Svgs TotalLeftoverServe Svgs TotalServe Svgs ALCServe Svgs ReimbAfter Cook TempTemp 1Temp 2
440107.14Chicken Corn Dog1 eachtongs2
534655.1Savory Green Beans1/2 cupspoodle-4oz2
639251Sweet Potato Fries1/2 cuptongs2
7
8Thursday, May 25, 2023
9GRILL
10Recipe #Recipe NamePortion SizeUtensilHACCPPrep Svgs TotalLeftoverServe Svgs TotalServe Svgs ALCServe Svgs ReimbAfter Cook TempTemp 1Temp 2
1143905.145Crispy Chicken Breast Sandwich1 sandwichtongs2
1234925.1101Classic American Cheeseburger1 sandwichtongs2
1334925.422Classic Beef Burger in Bun1 sandwichtongs2
1442877.22French Fries2-1/2 ouncetongs2
1552509.2Shredded Romaine Lettuce1/2 cupspoodle-4oz1
1637412.10Fresh Sliced Red Onion1/8 cupspoodle-1oz1
1737916.1Sliced Tomatoes3 eachtongs1
1849239.4Chipotle Mayo2 tbspscoop #302
1937796Buffalo Ranch Sauce1 flozladle-1oz1
20
21Thursday, May 25, 2023
22SONO
23Recipe #Recipe NamePortion SizeUtensilHACCPPrep Svgs TotalLeftoverServe Svgs TotalServe Svgs ALCServe Svgs ReimbAfter Cook TempTemp 1Temp 2
2434810.11Beef Taco Meat3/8 cupscoop #102
2534767.31Fajita Marinated Chicken2-1/2 oz meat2
2639573.8Tortilla Chips2 oz portiontongs1
2734654.53Cilantro Lime Quinoa Rice1 cupspoodle-8oz2
2839343.2Seasoned Black Beans1/2 cupscoop #82
2934655.4Mexicali Corn1/2 cupspoodle-4oz2
3052509.2Shredded Romaine Lettuce1/2 cupspoodle-4oz1
3137412Sauteed Bell Peppers and Onions1/2 cupspoodle-4oz2
3234934.3Salsa1/4 cupladle-2oz1
Original


regarding...
c - I then move to the worksheet called Formulas1. I created this sheet myself. It has lots of formulas in it and some colored cells.

I assume that you mean "copy" data from worksheet named Original to worksheet named Formulas1?

Where exactly is the data -- data groups 1 through 3 from worksheet named Original -- pasted into Formulas1?

It seems like there is a "summary data table" in the worksheet named Formulas1 for each of the data "groups" (1 through 3 from the worksheet named Original) that looks like this...

Sample ver2.xlsm
ABCDEFGHIJ
24MealsPlannedPreparedServed
25Reimb0
26Other
27ALC0
28Total00
Formulas1


Are the empty columns in the summary tables -- D, G, H, J -- necessary?

Presumably the three data groups from worksheet named Original are each pasted under such a "summary data table"?

That said, this is confusing...
And have the pasted data line up correctly with the colored cells.

Where (into which cells) are the three data groups worksheet named Original in Formulas1 pasted? Give a specific characterization/example with a copy of the worksheet Formulas1 like the one that you would start with.

Before the worksheet named Formulas1 is a worksheet named After Cleanup. How does that worksheet relate to copying data into worksheet Formulas1? What are formulas in columns G through I for?

The worksheet named Finished Product seems to be a combination of the three data groups from worksheet named Original and thos summary data tables from Formulas1?
 
Upvote 0


Hello OaklandJim,
Thank you so much for giving this attention and slogging through my overly large posts. Above are links to the original documents with company information blanked out.
Thank you for the macro to format the Report! Some of the formulas I have in the Formulas1 worksheet depend on whether or not the cells in Column B are formatted bold or not. The recipe names in bold are items that I need to count for the summary sections you mention later. Is it possible to keep the bold or not bold text formatting?

I will try to answer your questions as best I can in the order you asked them.

So the initial report you receive -- worksheet named Original -- has three sections, each with a variable number of rows?
The initial report has seven sections. Yes each has a variable number of rows.

I assume that you mean "copy" data from worksheet named Original to worksheet named Formulas1?
Yes, that is what I mean.

Where exactly is the data -- data groups 1 through 3 from worksheet named Original -- pasted into Formulas1?
I am using the blue colored rows to help me get lined up. Each section has a Date Row and a Name Row that go above the blue row and a block of information that goes below it.
These rows are from the new links above.

In the Report - Group 1 rows starting at A21 will be pasted to Formulas1 Rows A30 and down
In the Report - Group 2 rows starting at A28 will be pasted to Formulas1 Rows A46 and down
In the Report - Group 3 rows starting at A41 will be pasted to Formulas1 Rows A68 and down
In the Report - Group 4 rows starting at A57 will be pasted to Formulas1 Rows A90 and down
In the Report - Group 5 rows starting at A66 will be pasted to Formulas1 Rows A105 and down
In the Report - Group 6 rows starting at A83 will be pasted to Formulas1 Rows A132 and down
In the Report - Group 7 rows starting at A95 will be pasted to Formulas1 Rows A160 and down

It seems like there is a "summary data table" in the worksheet named Formulas1 for each of the data "groups"
You are correct. And each "group" is pasted under a summary table.
Are the empty columns in the summary tables -- D, G, H, J -- necessary?
No. They are relics and can be eliminated.

That said, this is confusing...
And have the pasted data line up correctly with the colored cells.
Where (into which cells) are the three data groups worksheet named Original in Formulas1 pasted? Give a specific characterization/example with a copy of the worksheet Formulas1 like the one that you would start with.
I hope I answered the where (into which cells) question above. If not let me know.
The link that leads to Revised Formula Sheet is an example of the blank Formulas1 worksheet. I have selected the "show formula view" (probably not helpful) to help illuminate that there are cells that can't be pasted into. They have formulas.
Here is a link to a small file that I hope will give you an example of what you need.


Before the worksheet named Formulas1 is a worksheet named After Cleanup. How does that worksheet relate to copying data into worksheet Formulas1? What are formulas in columns G through I for?
Ignore the worksheet After Cleanup please. I was trying to come up with a way to remove the empty spaces in spaces that look empty but aren't. I was also trying to count the rows in each group so that I could subtract them from the corresponding group in the formulas worksheet. A Byzantine scheme that was doomed to failure from the start I think. I probably never should have included it in my post.

The worksheet named Finished Product seems to be a combination of the three data groups from worksheet named Original and thos summary data tables from Formulas1?
Yes that is correct. The data groups are pasted into the Formulas1 worksheet, additional data is added, the summary data tables fill because of formulas, and the end result is Finished Product.

Thank you again for your patience and persistence. This is truly a monster.
 
Upvote 0
The first issue I see is that there are all those merged cells. I just refuse to work with them.

Let's start with the Report worksheet. Just so I am clear, that is the "raw" data as you receive it? It would have been nice to have that at the beginning. I wrote code to eliminate all the merged cells in the menu part that you sent (with three groups -- stations -- and without all the stuff at the top). Now that code may be useless. We'll see if I can unravel that.

I have a big question: are data fields at the top written or do you try to enter data into that in Excel? If the latter, then I would move the top part to a separate Input worksheet and leave it as-is with all the effing merged cells.

If it must be at the top of the report worksheet for some reason I could include a "picture" of that top part -- copied from the separate Input worksheet -- in the Report worksheet. Said another way, that "picture" shows the top part from the separate Input worksheet at the top of the Report worksheet. The picture appears just like the top part does now. If that sounds good I'll do that.

When I'm ready to deal with the formulas worksheet I'll have more questions. That looks pretty confusing. Same for the Final worksheet.

I'll see what I can do but this'll take a while.
 
Upvote 0
Here is what I have so far. 1. A new sheet is added called Inputs. The top of the Report worksheet is copied to the Input worksheet as is. The cells at the top of the Report worksheet -- cells where the top content was located -- are cleared out. 2. Presumably after the top part is filled in (in the Inputs worksheet), a picture of the top of the report is copied from the Inputs worksheet into the Report. 3. The merged cells in the Report are removed and the columns are resized so all of them combined are the same width as the picture of the top. Works and looks pretty good.

Next I'll try to understand how/where data from the Report worksheet are copied to the Formulas1 worksheet. Questions to follow.
 
Upvote 0
Here is a big issue. Formulas1 seems to have "extra" columns that are there to accommodate all the unused columns in the version of the Report that has merged cells. The issue is that code would be a lot more complicated if it has to move one value at a time from Report to Formulas1 than if the data for each station could be copied as a group.

The way I reconfigure the Report -- without merged cells and without extra columns -- it would be relatively straightforward to copy station's data as seven groups (contiguous cells as ranges) from Report to Formulas1. I'm not willing to do the transfer to the Formulas1 as it is configured. Extra columns in Formulas1 are B, D, F, H, I, K, L, N, P, Q, S, U, V, X, Z, AA, AC, AD, AE, AG, and AH. I see that columns F, I, V, Z include formulas. I hope that those formulas can be moved so the otherwise unused columns can be removed? I will proceed as if that can happen.

The same applies to the Final. Also, regarding Final, the version that you provided is confusing. Hopefully you can provide a version with some notes about what it does and how (and with unused columns removed). To add "notes" go to Insert => Illustrations => Shapes => Textbox (the one with the A in it). Those shapes can be moved and resized to make what you can think of as sticky notes.
 
Upvote 0
I had no idea that what I was asking was as difficult and complex as it is turning out to be. Nor did I know the right way to explain what I wanted. It is apparent to me now that I have a bigger project than I should have brought to this forum. And I made it needlessly harder with my style of communications. I understand if you want to bow out of this.

If you are willing to keep going, let me know and I will try to answer your questions as simply as I can.

Thank you again.
 
Upvote 0
I'm retired so I am ok with bigger projects. If I understand what is needed I'll get 'er done. I need to know about deleting "extra" columns in Formulas1 to avoid effects of merged cells in Report (which I reformatted to eliminate merged cells altogether). What about columns with cells in Formulas1 containing formulas: F, I, T, U, Y, Z. I need to delete those. Can you move those formulas then provide a link to the new Formulas1?
 
Upvote 0
Thank you for your continued efforts. Later, I will try to address your concerns one by one.

I made a mistake in how I originally described my needs. I now know this should have been made clearer and stated up front. Hopefully this provides a little more clarity.

- The Formulas worksheet becomes the final product after copying in the information from the Report and entering data from a third source into cells in the Formulas worksheet.

- The original Report worksheet is not used again after its information is copied into Formulas

- The first 19 rows of Report need to be copied from Column A to AK. I don't care if they stay merged although I found that unmerging them makes life a lot easier.

- In the Formulas sheet, I have recreated the "summary box" from Report A14:K19. I have inserted additional rows above the recreated summary box. The first 19 rows of Report can be put there. It will not be edited in excel once inserted into Formulas. It is only relevant to the final product because of the date and some legally required information.

- from row 20 to the end of the sheet, only the data in columns A through N need to be copied from Report to Formulas
My original intent was to copy ranges from columns A:N in Report and paste them into the appropriate place in Formulas. In Formulas, Columns O:AO remain untouched by the copy paste process. All the formulas in the Formula sheet exist to calculate what goes into the summary boxes. I ether need to keep them or have them copied back in.

If this makes you want to pass on this project now, I totally understand.
 
Upvote 0

Forum statistics

Threads
1,215,073
Messages
6,122,970
Members
449,095
Latest member
Mr Hughes

We've detected that you are using an adblocker.

We have a great community of people providing Excel help here, but the hosting costs are enormous. You can help keep this site running by allowing ads on MrExcel.com.
Allow Ads at MrExcel

Which adblocker are you using?

Disable AdBlock

Follow these easy steps to disable AdBlock

1)Click on the icon in the browser’s toolbar.
2)Click on the icon in the browser’s toolbar.
2)Click on the "Pause on this site" option.
Go back

Disable AdBlock Plus

Follow these easy steps to disable AdBlock Plus

1)Click on the icon in the browser’s toolbar.
2)Click on the toggle to disable it for "mrexcel.com".
Go back

Disable uBlock Origin

Follow these easy steps to disable uBlock Origin

1)Click on the icon in the browser’s toolbar.
2)Click on the "Power" button.
3)Click on the "Refresh" button.
Go back

Disable uBlock

Follow these easy steps to disable uBlock

1)Click on the icon in the browser’s toolbar.
2)Click on the "Power" button.
3)Click on the "Refresh" button.
Go back
Back
Top