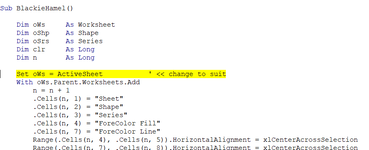
Sub BlackieHamel_r2()

    Dim oWs     As Worksheet
    Dim oWsPlot As Worksheet
    Dim oShp    As Shape
    Dim oChart  As Chart
    Dim oSrs    As Series
    Dim clr     As Long
    Dim n       As Long

    Set oWsPlot = ThisWorkbook.Worksheets.Add
    Call PlotInfo(oWsPlot, oChart, True)

    For Each oChart In ThisWorkbook.Charts
        Call PlotInfo(oWsPlot, oChart)
    Next oChart

    For Each oWs In ThisWorkbook.Worksheets
        For Each oShp In oWs.Shapes
            If oShp.Type = msoChart Then
                Call PlotInfo(oWsPlot, oShp.Chart)
            End If
        Next oShp
    Next oWs
    oWsPlot.Range("A1", oWsPlot.Columns(9)).Columns.AutoFit
End Sub

Sub PlotInfo(ByVal argWs As Worksheet, ByVal argChart As Chart, Optional ByVal argHeader As Boolean = False)

    Static n    As Long
    Dim oSrs    As Series
    Dim clr     As Long

    With argWs
        If argHeader Then
            n = 1
            .Cells(n, 1) = "Chart"
            .Cells(n, 2) = "Series"
            .Cells(n, 3) = "ForeColor Fill"
            .Cells(n, 6) = "ForeColor Line"
            Range(.Cells(n, 3), .Cells(n, 4)).HorizontalAlignment = xlCenterAcrossSelection
            Range(.Cells(n, 6), .Cells(n, 7)).HorizontalAlignment = xlCenterAcrossSelection
            Range(.Cells(n, 1), .Cells(n, 8)).Font.Bold = True
        Else
            For Each oSrs In argChart.FullSeriesCollection
                n = n + 1
                .Cells(n, 1) = oSrs.Parent.Parent.Name
                .Cells(n, 2) = oSrs.Name

                clr = oSrs.Format.Fill.ForeColor
                .Cells(n, 3) = clr
                .Cells(n, 4) = getRGB(clr)
                If Not clr = &HFFFFFF Then
                    .Cells(n, 5).Interior.Color = clr
                Else
                    .Cells(n, 5).Interior.Pattern = xlNone
                End If

                clr = oSrs.Format.Line.ForeColor
                .Cells(n, 6) = clr
                .Cells(n, 7) = getRGB(clr)
                If Not clr = &HFFFFFF Then
                    .Cells(n, 8).Interior.Color = clr
                Else
                    .Cells(n, 8).Interior.Pattern = xlNone
                End If
            Next
        End If
    End With
End Sub

Function getRGB(ByVal argColor As Long) As String
    Dim r As Integer, g As Integer, b As Integer
    r = (argColor And &HFF)
    g = (argColor And &HFF00&) / &H100
    b = (argColor And &HFF0000) / &H10000
    getRGB = "RGB(" & r & ", " & g & ", " & b & ")"
End Function