Sub Main()
Dim c As Chart, d As DataLabel, arr, i%, p As Point, pts As Points, cs As Worksheet, j%
Set cs = Sheets("sheet2")
Set c = cs.ChartObjects(1).Chart
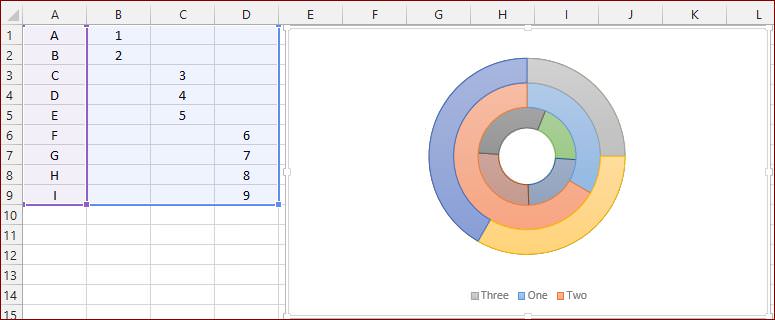
arr = Sheets("sheet1").[c20:c31]
c.FullSeriesCollection(3).ApplyDataLabels
j = 0
For i = cs.Range("d1").End(xlDown).Row To cs.Range("d" & Rows.Count).End(xlUp).Row
j = j + 1
Set p = c.FullSeriesCollection(3).Points(i)
p.DataLabel.Text = CStr(arr(j, 1))
Next
DoCircAlign c.FullSeriesCollection(3), 0
arr = Sheets("sheet1").[d20:d127]
j = 0
For i = cs.Range("g1").End(xlDown).Row To cs.Range("g" & Rows.Count).End(xlUp).Row
j = j + 1
Set p = c.FullSeriesCollection(6).Points(i)
p.DataLabel.Text = CStr(arr(j, 1))
Next
DoCircAlign c.FullSeriesCollection(6), 0
c.FullSeriesCollection(8).ApplyDataLabels
arr = Sheets("sheet1").[g20:g46]
j = 0
For i = cs.Range("i1").End(xlDown).Row To cs.Range("i" & Rows.Count).End(xlUp).Row
j = j + 1
Set p = c.FullSeriesCollection(8).Points(i)
p.DataLabel.Text = CStr(arr(j, 1))
Next
DoCircAlign c.FullSeriesCollection(8), 0
c.FullSeriesCollection(10).ApplyDataLabels
arr = Sheets("sheet1").[h20:h46]
j = 0
For i = cs.Range("k1").End(xlDown).Row To cs.Range("k" & Rows.Count).End(xlUp).Row
j = j + 1
Set p = c.FullSeriesCollection(10).Points(i)
p.DataLabel.Text = CStr(arr(j, 1))
Next
DoCircAlign c.FullSeriesCollection(10), 0
End Sub
Public Sub DoCircAlign(oSeries As Series, radial As Boolean)
' by Krisztina Szabó
Dim oChart As Chart, oPoint As Point, ox As Double, oy As Double, value
Dim sum As Double, angleSoFar As Double, i As Long
Set oChart = oSeries.Parent.Parent 'Series < ChartGroup < Chart
ox = oChart.PlotArea.Left + (oChart.PlotArea.Width / 2)
oy = oChart.PlotArea.Top + (oChart.PlotArea.Height / 2)
If oSeries.Type = xlPie Or oSeries.Type = xlDoughnut Then
sum = 0
For Each value In oSeries.Values
sum = sum + value
Next
i = 1
angleSoFar = oSeries.Parent.FirstSliceAngle 'Starts from 12h?
For Each oPoint In oSeries.Points
value = oSeries.Values(i)
angleSoFar = AlignSliceLabel(oChart, ox, oy, sum, angleSoFar, CDbl(value), _
oPoint, radial)
i = i + 1
Next
Else
For Each oPoint In oSeries.Points
Call AlignPointLabel(oChart, ox, oy, oPoint, radial)
Next
End If
'Error may occur: 'Method 'Position' of object 'DataLabels' failed
On Error Resume Next
oSeries.DataLabels.Position = xlLabelPositionOutsideEnd
End Sub
Private Function AlignSliceLabel#(ch As Chart, ox As Double, oy As Double, sum#, _
angleSoFar As Double, value As Double, oPoint As Point, radial As Boolean)
Dim oDataLabel As DataLabel, slice As Double, deg As Double
On Error Resume Next
Set oDataLabel = oPoint.DataLabel
On Error GoTo 0
If IsObject(oDataLabel) Then
slice = 360 * value / sum
deg = angleSoFar + slice / 2
If deg > 270 Then
deg = deg - 360
ElseIf deg > 180 Then
deg = deg - 180
ElseIf deg > 90 Then
deg = deg - 180
End If
If radial Then
oDataLabel.Orientation = IIf(deg <= 0, -90 - deg, 90 - deg)
Else
'Tangential
oDataLabel.Orientation = 0 - deg
End If
End If
AlignSliceLabel = angleSoFar + slice
End Function
Private Sub AlignPointLabel(ch As Chart, ox As Double, oy As Double, _
oPoint As Point, radial As Boolean)
Dim oDataLabel As DataLabel, rx#, ry#, dx#, dy#, tg As Double, rad#, deg#
On Error Resume Next
Set oDataLabel = oPoint.DataLabel
On Error GoTo 0
If IsObject(oDataLabel) Then
rx = (oPoint.Left + oPoint.Width / 2)
ry = (oPoint.Top + oPoint.Height / 2)
dx = rx - ox
dy = ry - oy
If dx <> 0 Then
tg = dy / dx
rad = Atn(tg)
deg = rad * 180 / WorksheetFunction.Pi
Else
deg = 90
End If
If radial Then
oDataLabel.Orientation = 0 - deg
Else
'Tangential
oDataLabel.Orientation = _
IIf(0 - deg - 90 >= -90, 0 - deg - 90, 0 - deg + 90)
End If
End If
End Sub