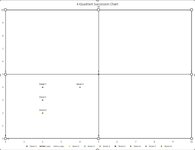
I need a script to scatter plot 8 sheets

khogan26

New Member
Joined
Jul 22, 2022
Messages
3
Office Version
  1. 365
Platform
  1. Windows
Hi,

I have an excel spreadsheet with 60 employees rows 41-101. Name is in Column A. I have 8 sheets where senior management (sheets 1 - 8) ranked each for potential and performance 1-10 in column B and C. I want to create a new sheet for each employeee name that scatter plots all 8 sheet rankings where B = X and C = Y from sheets 1- 8.

I am very bad at scripting.

Thank you,

Ken
 

Attachments

  • example.JPG
    example.JPG
    31.7 KB · Views: 10

Excel Facts

Pivot Table Drill Down
Double-click any number in a pivot table to create a new report showing all detail rows that make up that number
Maybe my title puts folks off. May I please get some help? My CEO is on me for this and I just don't have the scripting skills.

Thank you in advance.
 
Upvote 0

Forum statistics

Threads
1,215,223
Messages
6,123,714
Members
449,118
Latest member
MichealRed

We've detected that you are using an adblocker.

We have a great community of people providing Excel help here, but the hosting costs are enormous. You can help keep this site running by allowing ads on MrExcel.com.
Allow Ads at MrExcel

Which adblocker are you using?

Disable AdBlock

Follow these easy steps to disable AdBlock

1)Click on the icon in the browser’s toolbar.
2)Click on the icon in the browser’s toolbar.
2)Click on the "Pause on this site" option.
Go back

Disable AdBlock Plus

Follow these easy steps to disable AdBlock Plus

1)Click on the icon in the browser’s toolbar.
2)Click on the toggle to disable it for "mrexcel.com".
Go back

Disable uBlock Origin

Follow these easy steps to disable uBlock Origin

1)Click on the icon in the browser’s toolbar.
2)Click on the "Power" button.
3)Click on the "Refresh" button.
Go back

Disable uBlock

Follow these easy steps to disable uBlock

1)Click on the icon in the browser’s toolbar.
2)Click on the "Power" button.
3)Click on the "Refresh" button.
Go back
Back
Top