Is there a way in Power Query to denormalize a table?

Alex20850

Board Regular
Joined
Mar 9, 2010
Messages
146
Office Version
  1. 365
Platform
  1. Windows
I have worked with Power Query before and thought there was a way to denormalize a table.

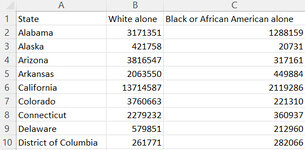
The original data is State and different ethnic groups as different columns with the rows with population for each ethnic group.

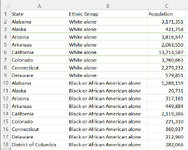
I would like the output to be three columns
State Ethnic group Population
 

Attachments

  • After.jpg
    After.jpg
    168.4 KB · Views: 8
  • Before.jpg
    Before.jpg
    65.3 KB · Views: 8

Excel Facts

What do {} around a formula in the formula bar mean?
{Formula} means the formula was entered using Ctrl+Shift+Enter signifying an old-style array formula.
Select state column, right click and from the context menu choose Unpivot other columns.
 
Upvote 0
Solution

Forum statistics

Threads
1,215,092
Messages
6,123,063
Members
449,090
Latest member
fragment

We've detected that you are using an adblocker.

We have a great community of people providing Excel help here, but the hosting costs are enormous. You can help keep this site running by allowing ads on MrExcel.com.
Allow Ads at MrExcel

Which adblocker are you using?

Disable AdBlock

Follow these easy steps to disable AdBlock

1)Click on the icon in the browser’s toolbar.
2)Click on the icon in the browser’s toolbar.
2)Click on the "Pause on this site" option.
Go back

Disable AdBlock Plus

Follow these easy steps to disable AdBlock Plus

1)Click on the icon in the browser’s toolbar.
2)Click on the toggle to disable it for "mrexcel.com".
Go back

Disable uBlock Origin

Follow these easy steps to disable uBlock Origin

1)Click on the icon in the browser’s toolbar.
2)Click on the "Power" button.
3)Click on the "Refresh" button.
Go back

Disable uBlock

Follow these easy steps to disable uBlock

1)Click on the icon in the browser’s toolbar.
2)Click on the "Power" button.
3)Click on the "Refresh" button.
Go back
Back
Top