willow-mouse
New Member
- Joined
- Aug 25, 2010
- Messages
- 17
I have a table with product SKU, sq m, cost:
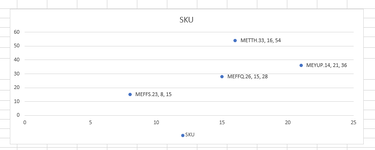
I have created a scatter graph with sq metres (m) along the x and cost (£) on the y. There are some anomalous results which I need to call out for discussion. I would like to put data labels on these with the X, Y and a value from cell (the SKU) which would look like the below:

I have achieved this by adding data labels to the entire series and then deleting the ones I don't want:

However I have hundreds of data points, and when I add a single data label and then format just that single point I have the following options:

Is there any way to achieve this without either manually adding a box (data is changing and it'll not move with it - which is a problem) or by adding the required formatting and then manually deleting every single point I don't want (which will take way too long).
TIA.
| SKU | Sq m (m2) | Cost (£) |
| MEFFS.23 | 8 | 15 |
| MEFFQ.26 | 15 | 28 |
| METTH.33 | 16 | 54 |
| MEYUP.14 | 21 | 36 |
I have created a scatter graph with sq metres (m) along the x and cost (£) on the y. There are some anomalous results which I need to call out for discussion. I would like to put data labels on these with the X, Y and a value from cell (the SKU) which would look like the below:
I have achieved this by adding data labels to the entire series and then deleting the ones I don't want:
However I have hundreds of data points, and when I add a single data label and then format just that single point I have the following options:
Is there any way to achieve this without either manually adding a box (data is changing and it'll not move with it - which is a problem) or by adding the required formatting and then manually deleting every single point I don't want (which will take way too long).
TIA.