The_Steward
Board Regular
- Joined
- Nov 26, 2020
- Messages
- 63
- Office Version
- 365
- Platform
- Windows
Good Afternoon,
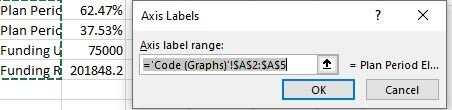
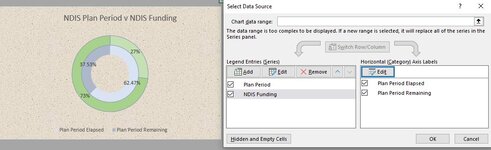
I am rather new to using charts and I am currently using a donut chart to with two series and 4 legends (Horizontal Labels) but only 2 legends appear on graph and only two horizontal labels appear in horizontal axis labels despite 4 cells with text being selected in data source. How do I fix this?
Please see images for further details