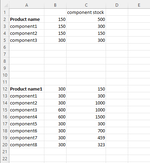
Hey, i got a excel sheet with product name, components needed to create the product and the component storage stock. It looks like this:

Each component needed for the product is listed below each product (i got 10 lines with a formula to get the components of each product and i just filter the blank cells because there is no one specific number of components. Most got 3-8 components and no products has over 10 components).
The number next to the product name is the qty of that product we will be making and the number needed of each component to create the product next to each component and then component stock next to the number of needed components.
So what im looking for is 2 things: in D2 and D12 i want formulas that checks if all component numbers in A2 and A12 is higher then the component stock number easily check if the product component status is "OK" or "MISSING COMPONENTS". So one formula checks A2 and one checks A12.
Im also looking for a formula to display all components that has a lower component needed number then component stock so i easily can get a overview of the components missing from all the products. It should be a list that display all component names and the amount that we are missing.
example of the second thing im looking for:
lets say component6 and component7 numbers was higher then component stock number on both of them
component6 stock 200
component7 stock 200
i want a formula that would display component6 in one cell and in the next cell 300 - 200 (stock number - number needed)
output: "component6" in one cell and "100 needed" in the next cell and then in the cells under "component7" and "100 needed" in the next cell.
Attachments
Last edited:


