Need formula range to automatically expand when a new row is added to table

Mike423

New Member
Joined
Apr 21, 2023
Messages
18
Office Version
  1. 365
Platform
  1. Windows
I'm currently using the below formula to sum individual payroll values from a large table into a smaller, summary table.

=IF(D2="YTD",SUMPRODUCT((G4:BQ13)*(G3:BQ3=A6)*(F4:F13=B2)),SUMPRODUCT((G4:BQ13)*(F4:F13=B2)*(G2:BQ2=D2)*(G3:BQ3=A6)))

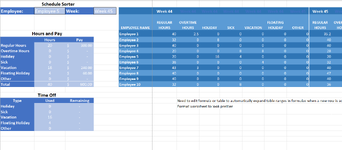
My question is, how can I modify this formula, so that when I drag the bottom row of the table down (it is actually a table, not just a range) to add a new row, the ranges in the formula adjust along with it to include any data entered into the new row? Picture is attached.

Thank you.
 

Attachments

  • Table Screenshot.png
    Table Screenshot.png
    86.9 KB · Views: 25
I think the mystery still involves your table designation (the XL2BB add-in doesn't convey table details). Could you click anywhere in that table, go to the Table Design menu and tell me what the status of the "Header Row" check box is. Here is mine. I'm wondering if you have a header row that is turned off (and if it is turned on, will you see headings of Column1, Column2, etc.?).

1699110525778.png
 
Upvote 0

Excel Facts

Repeat Last Command
Pressing F4 adds dollar signs when editing a formula. When not editing, F4 repeats last command.
Okay, thank you...that explains it! So your table has a header with unique column names, but you are not showing it (the headings) because of this setting. If you check the Header Row box, you should see your table shift down and the column names will appear. I'd recommend do that, move the entire table, if necessary, so that the header row appears on a row with nothing to the left or right, and then hiding that heading row (select the entire row where you'll probably see Column1, Column2, etc. by clicking on the row number at left, then right click, and choose Hide from the pop up menu). This will allow formulas to refer to the column headings even though we won't be able to see them.
 
Upvote 0
Give this a try. I've shown two approaches: one based on your original SUMPRODUCT idea (the lower Time Off section), the other based on summing the results of several FILTERS (the upper Hours and Pay section). The key is understanding how your table is structured so that we know which rows to use for performing the matches. I'm not able to see the details behind the VLOOKUP formulas (as I don't see the 'Employee Details' sheet), but I tend to avoid VLOOKUP. I would probably use XLOOKUP and then rather than specifying the range of Employee Names, use the TableName[ColumnName] structured reference so that the employee name list can expand or shrink...and that part of your formula will automatically consider the correct range.
MrExcel_20231030_B.xlsx
ABCD
1Schedule Sorter
2Employee:Employee 1Week:YTD
4Hours and Pay
5HoursPay
6Regular Hours75.2#N/A
7Overtime Hours3.3#N/A
8Holiday5#N/A
9Sick4#N/A
10Vacation0#N/A
11Floating Holiday0#N/A
12Other0#N/A
13Total87.5#N/A
14
15Time Off
16TypeUsedRemaining
17Holiday5#N/A
18Sick4#N/A
19Vacation0#N/A
20Floating Holiday0#N/A
21Other0#N/A
Sheet8
Cell Formulas
RangeFormula
B6:B12B6=LET(HrType,$A6,EmpName,$B$2,qryWk,$D$2,HrTypeLst,$A$6:$A$12,DataTbl,Weekly_Payroll3, DataRng,DROP(DataTbl,1),HdrWkGrps,TAKE(DataTbl,1), EmpCol,TAKE(DataRng,,1), HdrHrType,TAKE(DataRng,1), hary,IF(qryWk="YTD", FILTER(DataRng,HdrHrType=HrType), LET(wkary,TAKE(DROP(DataRng,,MATCH(qryWk,HdrWkGrps,0)-1),,ROWS(HrTypeLst)),FILTER(wkary,TAKE(wkary,1)=HrType))), finsum,SUM(FILTER(hary,EmpCol=EmpName)),finsum)
C6:C12C6=((VLOOKUP($B$2,'Employee Details'!$C$2:$D$12,2,0))*B6)
B13:C13B13=SUM(B6:B12)
B17:B21B17=SUMPRODUCT(DROP(Weekly_Payroll3,2,1),DROP((CHOOSEROWS(Weekly_Payroll3,2)=$A17)*(TAKE(Weekly_Payroll3,,1)=$B$2)*IF($D$2="YTD",1,TAKE(Weekly_Payroll3,1)=$D$2),2,1))
C17:C21C17=IF($D$2="YTD",VLOOKUP($B$2,'Employee Details'!$C$1:$I$12,3,0)-B17,"-")

MrExcel_20231030_B.xlsx
FGHIJKLMNOPQRST
2
4Week 44Week 44Week 44Week 44Week 44Week 44Week 44Week 45Week 45Week 45Week 45Week 45Week 45Week 45
5EMPLOYEE NAMEREGULAR HOURSOVERTIME HOURSHOLIDAYSICKVACATIONFLOATING HOLIDAYOTHERREGULAR HOURSOVERTIME HOURSHOLIDAYSICKVACATIONFLOATING HOLIDAYOTHER
6Employee 1402.54000035.20.814000
7Employee 23208000040000000
8Employee 34000000040000000
9Employee 42000880028004800
10Employee 5200164000200301640
11Employee 63600040032000080
12Employee 74330000040000000
13Employee 84000000047700000
14Employee 94000000040000000
15Employee 103200800036000004
Sheet8
 
Upvote 0
I was finally able to figure out this formula. The final one I used is =LET(r,FILTER(Weekly_Payroll,Weekly_Payroll[Employee]=B$3), ci,FILTER(SEQUENCE(COLUMNS(Weekly_Payroll)),TRANSPOSE(INDEX(Weekly_Payroll,2,0))=A7), di,"INDEX(Weekly_Payroll[#Headers],ci-MIN(ci)+2)", IF(D$3="YTD",SUM(INDEX(r,ci)),INDEX(r,LOOKUP(D$3,di,ci)))).

Thanks for all your help!
 
Upvote 0
I don't understand how that can work for cases where a week number is queried. The ci-MIN(ci)+2 and INDEX(r,LOOKUP(D$3,di,ci)) won't give you the column corresponding to a specific week. Something is different between your table (which has headings that I can't see) and what I've mocked up. For example, I can tell that your first column heading must be called [Employee] since you've referenced it in your formula...the first I've heard about that.

If you go to an open space in your worksheet where information can spill out to the right, what do you get if you enter:
=INDEX(Weekly_Payroll,1,)
and then try...
=INDEX(Weekly_Payroll,2,)
I'm curious what the table structure on your system considers as rows 1 and 2 and this will show that.
 
Last edited:
Upvote 0
You are correct, it looked like it was working at first, but now the week change is the only thing it is not responding to..
 
Upvote 0
How would I edit those couple of areas of the function to have it account for the change in week?
 
Upvote 0
I suspect something is off with our table structures. Try this variation on yours. This establishes tbl as your source table, and then ri and ci are arrays of the relevant row and column indexes of interest. A single SUM formula is then used, and we use an internal IF statement to determine whether to ignore the column indices (when "YTD" is selected) or utilize them (when a specific week is chosen).
Excel Formula:
=LET(tbl,Weekly_Payroll,
ci,FILTER(SEQUENCE(,COLUMNS(tbl)),INDEX(tbl,1,)=$A7),
ri,FILTER(SEQUENCE(ROWS(tbl)),INDEX(tbl,,1)=$B$3),
SUM(INDEX(tbl,ri,IF($D$3="YTD","",MATCH($D$3,Weekly_Payroll[#Headers],0)))))

You may need to edit the INDEX(tbl,1,) in the ci formula to get the correct table row...I'm not sure what row 1 is in your setup.
 
Upvote 0
Sorry...what I posted isn't correct. Looking at it now.
 
Upvote 0

Forum statistics

Threads
1,215,069
Messages
6,122,953
Members
449,095
Latest member
nmaske

We've detected that you are using an adblocker.

We have a great community of people providing Excel help here, but the hosting costs are enormous. You can help keep this site running by allowing ads on MrExcel.com.
Allow Ads at MrExcel

Which adblocker are you using?

Disable AdBlock

Follow these easy steps to disable AdBlock

1)Click on the icon in the browser’s toolbar.
2)Click on the icon in the browser’s toolbar.
2)Click on the "Pause on this site" option.
Go back

Disable AdBlock Plus

Follow these easy steps to disable AdBlock Plus

1)Click on the icon in the browser’s toolbar.
2)Click on the toggle to disable it for "mrexcel.com".
Go back

Disable uBlock Origin

Follow these easy steps to disable uBlock Origin

1)Click on the icon in the browser’s toolbar.
2)Click on the "Power" button.
3)Click on the "Refresh" button.
Go back

Disable uBlock

Follow these easy steps to disable uBlock

1)Click on the icon in the browser’s toolbar.
2)Click on the "Power" button.
3)Click on the "Refresh" button.
Go back
Back
Top