Need to determine an ideal ratio

sbrien

New Member
Joined
Jun 5, 2012
Messages
19
Hello all,

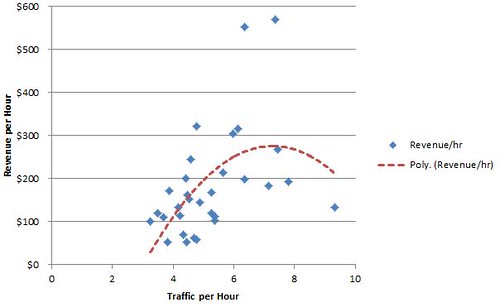
I'm haven't played with stats in a while and now I'm trying to determine the ideal traffic/labor hour in order to maximize revenue/labor hour. My data looks like this:

Excel 2010
ABCDEF
1DateTrafficRevenueHoursTraffic/hrRevenue/hr
27/1/2012144 $ 2,072.16 15.459.320388 $ 134.12
37/2/2012163 $ 7,395.98 36.854.423338 $ 200.71
47/3/2012142 $ 3,802.03 33.524.236277 $ 113.43
57/4/201294 $ 3,020.40 22.584.162976 $ 133.76
67/5/2012144 $ 4,843.29 31.824.525456 $ 152.21
77/6/2012174 $ 8,885.81 29.135.973223 $ 305.04
87/7/2012177 $ 3,349.87 32.965.370146 $ 101.63
97/8/2012116 $ 7,811.72 24.284.777595 $ 321.73
107/9/2012160 $ 5,116.48 30.335.275305 $ 168.69
117/10/2012136 $ 1,617.67 30.524.456094 $ 53.00
127/11/2012153 $ 6,816.25 39.53.873418 $ 172.56
137/12/2012122 $ 1,972.75 28.034.352479 $ 70.38
147/13/2012203 $ 7,310.88 27.277.444078 $ 268.09
157/14/2012165 $ 6,239.02 29.185.654558 $ 213.81
167/15/2012126 $ 2,652.57 23.465.370844 $ 113.07
177/16/2012195 $ 10,033.34 31.756.141732 $ 316.01
187/17/2012147 $ 4,593.56 23.146.352636 $ 198.51
197/18/2012156 $ 5,319.05 44.693.490714 $ 119.02
207/19/2012130 $ 1,801.60 33.913.833677 $ 53.13
217/20/2012220 $ 5,415.52 28.217.798653 $ 191.97
227/21/2012146 $ 12,727.49 236.347826 $ 553.37
237/22/2012110 $ 8,519.18 14.937.367716 $ 570.61
247/23/2012166 $ 5,006.82 45.193.673379 $ 110.79
257/24/2012166 $ 8,823.67 36.134.59452 $ 244.22
267/25/2012152 $ 4,722.04 46.633.259704 $ 101.27
277/26/2012140 $ 4,136.81 28.614.893394 $ 144.59
287/27/2012162 $ 3,711.42 30.775.264868 $ 120.62
297/28/2012162 $ 4,133.91 22.667.149162 $ 182.43
307/29/2012137 $ 1,657.63 28.774.761905 $ 57.62
317/30/2012127 $ 4,590.15 28.324.484463 $ 162.08
327/31/2012100 $ 1,319.93 21.364.681648 $ 61.79

<colgroup><col style="width: 25pxpx"><col><col><col><col><col><col></colgroup><thead>
</thead><tbody>
</tbody>
Sheet1


I don't know if Excel or Analyst Toolpak has the firepower for this or if I'll need additional tools. I appreciate any direction you can give me on this.

Thanks,
Sam
 

Excel Facts

Excel Wisdom
Using a mouse in Excel is the work equivalent of wearing a lanyard when you first get to college
Hi Sam,

I'm not an expert at statistics either, but since you haven't had any replies after 36 hours, I thought I'd try to help.

Below is a Scatter Chart showing the data with a trend line that attempts to fit a polynomial equation.

Hopefully this gives you a better visual understanding of your data.

If nothing else, it gives your thread a bump that might catch the attention of someone more knowledgeable on the topic. :)

7861727252_11bfbcfc2d.jpg
 
Upvote 0
I think you need to be a bit more precise in what you are trying to do. Is this a queue problem (how many staff do I need) in which case you need to say what happens to the traffic you cant handle and how traffic turns into revenue based on the staff hours.

If what you are asking is how do I maximise profits then that is probably a linear programming problem. In which case Solver (a toy LP that is given away with Excel Analysis ToolPack) may be man enough for the job if your problem is really simple but once you get to most real world problems you need either to buy a better version of Solver or one of its rivals (What'sBest is my favourite) which are fairly pricy or use one of the open source solvers that are kicking around the web - I have used lpsolve which someone has written a dll version of which allows you to use it with VBA and seems to work very well but as it is open source you need to put in a fair bit of effort to use it effectively

HTH
 
Upvote 0
Thanks Jerry. Do you know if there is a function to obtain a "best fit" polynomial equation given a a set of data? Although the data is somewhat random, I've got about 2000 stores I'd like to run this for and plotting a graph for each one isn't feasible...

-Sam
 
Upvote 0
HTH,

Thanks for the insight. I don't think my bosses are interested in a sophisticated answer that accounts for all the what ifs. A best guess scenario using a reasonable trend seems to be sufficient. Thanks also for the insights into various Solver alternatives. I'll take a look, though the learning curve likely won't fit with the quick turnaround on this project.

Cheers,
Sam
 
Upvote 0
Sam, The more data that you have, the more likely you'll be able to see a meaningful correlation for just the two factors charted.
So doing a similar analysis will data from all 2000 stores will have some benefit, though it won't control for factors that differ between the stores. The 3 outlying points (above $500/hr and traffic greater than 9/hr), are skewing the trend in this sample.

My understanding is that applying a trend line with the polynomial option attempts to find the "best fit" for the order number selected.
I don't know of an automated way in Excel to look at a set of data and determine which trend/regression type is the best fit.

It makes sense that your stores will have a point of diminishing returns in which increases in traffic will not yield proportional increases in revenue for a store, so polynomial could be a better representation of the trend than linear.

As noted, I don't have any expertise on this topic and I'd be happy to learn more on this topic from someone who does.
 
Upvote 0

Forum statistics

Threads
1,215,514
Messages
6,125,263
Members
449,219
Latest member
daynle

We've detected that you are using an adblocker.

We have a great community of people providing Excel help here, but the hosting costs are enormous. You can help keep this site running by allowing ads on MrExcel.com.
Allow Ads at MrExcel

Which adblocker are you using?

Disable AdBlock

Follow these easy steps to disable AdBlock

1)Click on the icon in the browser’s toolbar.
2)Click on the icon in the browser’s toolbar.
2)Click on the "Pause on this site" option.
Go back

Disable AdBlock Plus

Follow these easy steps to disable AdBlock Plus

1)Click on the icon in the browser’s toolbar.
2)Click on the toggle to disable it for "mrexcel.com".
Go back

Disable uBlock Origin

Follow these easy steps to disable uBlock Origin

1)Click on the icon in the browser’s toolbar.
2)Click on the "Power" button.
3)Click on the "Refresh" button.
Go back

Disable uBlock

Follow these easy steps to disable uBlock

1)Click on the icon in the browser’s toolbar.
2)Click on the "Power" button.
3)Click on the "Refresh" button.
Go back
Back
Top