Novice Guidance

ylafont

New Member
Joined
Jun 21, 2016
Messages
36
Office Version
  1. 365
  2. 2021
Platform
  1. Windows
For the past few years, I have been manually tracking data reporting on user activity. it hasn't been bad since it is not performed excessively and I want to try to automate it in some manner to alleviate the burden and i thought this was the perfect to to understand and learn BI.

Data is exported daily as Excel files and kept in a folder, here is a modified sample, there are many columns and we are only displaying the ones needed for this exercise.
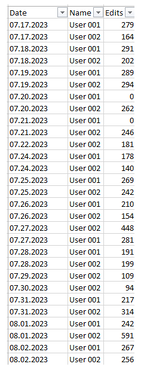
Daily.png
To track and report daily user activity, I have been manually transposing the data like so.
Daily2.png

With this, I can track daily users/group performance and retain a historical log. Note not every user has an activity every day and some days have no activity.

The goal was for me to somehow automate a daily report, can anyone provide guidance on how to perform this in BI or alternative solution? thank you in advance!
 

Excel Facts

Can you AutoAverage in Excel?
There is a drop-down next to the AutoSum symbol. Open the drop-down to choose AVERAGE, COUNT, MAX, or MIN
I don't have exposure to Power BI but looking at your data Pivot Tables can also be a solution. The only challenge is how data is updated in a file on daily basis.
 
Upvote 0
Using Power Query within PBI

Power Query:
let
    Source = Excel.CurrentWorkbook(){[Name="Table1"]}[Content],
    #"Changed Type" = Table.TransformColumnTypes(Source,{{"Date", type date}}),
    #"Pivoted Column" = Table.Pivot(Table.TransformColumnTypes(#"Changed Type", {{"Date", type text}}, "en-US"), List.Distinct(Table.TransformColumnTypes(#"Changed Type", {{"Date", type text}}, "en-US")[Date]), "Date", "Value", List.Sum)
in
    #"Pivoted Column"

MOCK_DATA.xlsx
ABCDEFGHIJKLMNOPQRSTU
1Datefirst_nameValuefirst_name9/15/20239/16/20239/17/20239/18/20239/19/20239/20/20239/21/20239/22/20239/23/20239/24/20239/25/20239/26/20239/27/20239/28/20239/29/20239/30/2023
29/15/2023user163.38user163.3880.23.3725.2990.7194.4685.387.7270.2644.9558.9832.3943.1111.17
39/16/2023user180.2user219.9679.2936.7651.0322.5196.0514.0799.2627.9252.4322.6467.2961.8270.81103.251.8
49/17/2023user13.37
59/18/2023user125.29
69/19/2023user190.71
79/20/2023user194.46
89/21/2023user185.38
99/22/2023user17.72
109/23/2023user170.26
119/24/2023user144.95
129/25/2023user158.98
139/26/2023user132.39
149/27/2023user143.11
159/28/2023user111.17
169/29/2023user290.68
179/30/2023user244.27
189/15/2023user219.96
199/16/2023user279.29
209/17/2023user236.76
219/18/2023user251.03
229/19/2023user222.51
239/20/2023user296.05
249/21/2023user214.07
259/22/2023user299.26
269/23/2023user227.92
279/24/2023user252.43
289/25/2023user222.64
299/26/2023user267.29
309/27/2023user261.82
319/28/2023user270.81
329/29/2023user212.52
339/30/2023user27.53
data
 
Upvote 0

Forum statistics

Threads
1,215,613
Messages
6,125,834
Members
449,266
Latest member
davinroach

We've detected that you are using an adblocker.

We have a great community of people providing Excel help here, but the hosting costs are enormous. You can help keep this site running by allowing ads on MrExcel.com.
Allow Ads at MrExcel

Which adblocker are you using?

Disable AdBlock

Follow these easy steps to disable AdBlock

1)Click on the icon in the browser’s toolbar.
2)Click on the icon in the browser’s toolbar.
2)Click on the "Pause on this site" option.
Go back

Disable AdBlock Plus

Follow these easy steps to disable AdBlock Plus

1)Click on the icon in the browser’s toolbar.
2)Click on the toggle to disable it for "mrexcel.com".
Go back

Disable uBlock Origin

Follow these easy steps to disable uBlock Origin

1)Click on the icon in the browser’s toolbar.
2)Click on the "Power" button.
3)Click on the "Refresh" button.
Go back

Disable uBlock

Follow these easy steps to disable uBlock

1)Click on the icon in the browser’s toolbar.
2)Click on the "Power" button.
3)Click on the "Refresh" button.
Go back
Back
Top