Hello,
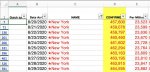
I am keeping a running chart on Covid 19 cases per state in the US and its territories. I want to calculate percent change for each state, but on my spreadsheet the new data won't necessarily always be the same number of rows away from the previous data. In the image you can see that New York is on line 7, 71, 136 etc. so they are not always the same number of rows away from the previous row. I'm wondering if there is a formula that will say, in column C, find the previous instance of this states name (in this case New York) and do the calculation. I assume this will be some sort of array with a calculation, but can't quite figure it out.
I am keeping a running chart on Covid 19 cases per state in the US and its territories. I want to calculate percent change for each state, but on my spreadsheet the new data won't necessarily always be the same number of rows away from the previous data. In the image you can see that New York is on line 7, 71, 136 etc. so they are not always the same number of rows away from the previous row. I'm wondering if there is a formula that will say, in column C, find the previous instance of this states name (in this case New York) and do the calculation. I assume this will be some sort of array with a calculation, but can't quite figure it out.