Hi all,
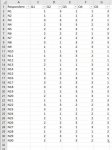
I have a dataset with many questions (Q1, Q2, Q3 etc.), and each question contains categorical data in the same format. For instance respondents answered 1 (low), 2 (moderate), 3 (high).
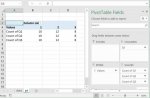
I created a pivot table, and it is easy to summarize Q1 to show the COUNT of respondents who selected 1, 2 or 3... (count of Q1 in values, and Q1 also in columns). So far so good.
However, my problem is how to use the same pivot table to also show the COUNT for Q2, Q3, Q3,...Q10.
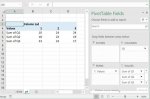
What happens is that, with Q1 still in the pivot table 'Columns' field, the other questions take the same values as Q1. This is not correct - How to I get Excel to show the correct COUNT for each question under the same column headers?
Some other info: strangely, if I change COUNT to SUM then Q1, Q2, Q3 will show unique values and not just take the Q1 values... but I need this to work with COUNT and not SUM.
I realise I could make one pivot table for each question, but this would be a bad idea: In my real dataset I have many respondents and many questions. I need this displaying as a simple set of summary tabulated data.
I have attached some screenshots, and the file is here: public-forums - Google Drive
Much thanks for your help
Rogerbij
I have a dataset with many questions (Q1, Q2, Q3 etc.), and each question contains categorical data in the same format. For instance respondents answered 1 (low), 2 (moderate), 3 (high).
I created a pivot table, and it is easy to summarize Q1 to show the COUNT of respondents who selected 1, 2 or 3... (count of Q1 in values, and Q1 also in columns). So far so good.
However, my problem is how to use the same pivot table to also show the COUNT for Q2, Q3, Q3,...Q10.
What happens is that, with Q1 still in the pivot table 'Columns' field, the other questions take the same values as Q1. This is not correct - How to I get Excel to show the correct COUNT for each question under the same column headers?
Some other info: strangely, if I change COUNT to SUM then Q1, Q2, Q3 will show unique values and not just take the Q1 values... but I need this to work with COUNT and not SUM.
I realise I could make one pivot table for each question, but this would be a bad idea: In my real dataset I have many respondents and many questions. I need this displaying as a simple set of summary tabulated data.
I have attached some screenshots, and the file is here: public-forums - Google Drive
Much thanks for your help
Rogerbij