Populating row headers based on column values

Jonam711

New Member
Joined
Jun 11, 2022
Messages
18
Office Version
  1. 365
Platform
  1. Windows
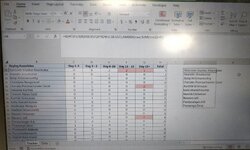
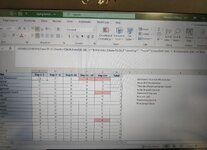
Hey guys - I'm working on a daily report were 20 employees update their daily data in sheet 1 following are the column headers in sheet 1"status" drop down list - pending, processed, on hold. the sheet has other columns such as Date when assigned, completed date, no of days pending or on hold. By the end of the day one has to publish the pending/on hold count of each employees based on days range as shown in the attached image (sheet 2). The formulas I put in sheet 2 are working fine. But how it's done now is I have made a list of all the 20 employees and I used "SORT" for that list so all the 20 emps names comes up and we manually delete the rows of employees who don't have any pending counts in any of the days bucket. If you see out of 20 employees only let's say 7 employees have pending/on hold under their names and I need to populate only those 7 employees in a column and show their pending counts.
 
Hi,

maybe I didn't understand what you are asking.. You asked for the names and values of those who had total sum >0 in your table C18:G22.

So the formula I have placed in B25 provides the names, and values of all those in the table that are total>0. The values are shown after the names ?

what did I miss here ?

thanks
Rob
Hello - I get only the names whose values had total sum >0, their values not pulling up
 
Upvote 0

Excel Facts

Did you know Excel offers Filter by Selection?
Add the AutoFilter icon to the Quick Access Toolbar. Select a cell containing Apple, click AutoFilter, and you will get all rows with Apple
Ok, I don’t understand why that would be, so you will probably need to share the formula that you use to populate your values , and also how your data is laid out so we can see how the formula is interacting with it.
thanks
Rob
 
Upvote 0
Left table is base table
 

Attachments

  • IMG_20230824_223136__01.jpg
    IMG_20230824_223136__01.jpg
    143.7 KB · Views: 8
Upvote 0
And the formula in c38 etc. is what ? And the data that formula interacts with is laid out how ?
 
Upvote 0
And the formula in c38 etc. is what ? And the data that formula interacts with is laid out how ?
Hello - Sorry Rob for the delay, basically the idea is to get the count of pending/on hold requests for every associate based on their how long they are pending (day bucket) let me give you a picture what are the columns that I used in the cells C38 etc, Sheet Data column F - the associates names, column D - dates, column S - status of a request which are pending or on hold, Column AE - the days it's been in pending/on hold.
 

Attachments

  • IMG_20230826_003506__01.jpg
    IMG_20230826_003506__01.jpg
    125.5 KB · Views: 6
Upvote 0

Forum statistics

Threads
1,215,069
Messages
6,122,959
Members
449,096
Latest member
Anshu121

We've detected that you are using an adblocker.

We have a great community of people providing Excel help here, but the hosting costs are enormous. You can help keep this site running by allowing ads on MrExcel.com.
Allow Ads at MrExcel

Which adblocker are you using?

Disable AdBlock

Follow these easy steps to disable AdBlock

1)Click on the icon in the browser’s toolbar.
2)Click on the icon in the browser’s toolbar.
2)Click on the "Pause on this site" option.
Go back

Disable AdBlock Plus

Follow these easy steps to disable AdBlock Plus

1)Click on the icon in the browser’s toolbar.
2)Click on the toggle to disable it for "mrexcel.com".
Go back

Disable uBlock Origin

Follow these easy steps to disable uBlock Origin

1)Click on the icon in the browser’s toolbar.
2)Click on the "Power" button.
3)Click on the "Refresh" button.
Go back

Disable uBlock

Follow these easy steps to disable uBlock

1)Click on the icon in the browser’s toolbar.
2)Click on the "Power" button.
3)Click on the "Refresh" button.
Go back
Back
Top