marksaba20
New Member
- Joined
- Feb 2, 2024
- Messages
- 2
- Office Version
- 365
- Platform
- Windows
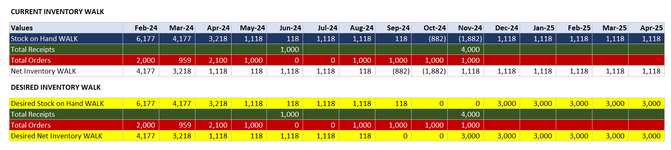
I have an Inventory Walk table that has month on columns and values on rows. Rows consist of Stock on Hand, Total Receipts, Total Demand, and Net Inventory.
Stock On Hand is always the current month, then Total Receipts and Total Demand for each month. Net Inventory is a measure that is Stock On Hand + Total Receipts - Total Demand. Using the below function, I was able to successfully build out the walk, allowing it to roll by month.
In the image linked below, I have shown what this Net Inventory WALK function returns AND below that, I showcased what I would prefer it to look like. In the Desired Net Inventory WALK, when a column returns a negative value for Net Inventory WALK, I want it to return as a ZERO. I then want the beginning Stock on Hand for the following month to be a ZERO, instead of negative.
ImageOfTable
For reference, the Stock on Hand WALK function is as shown below, which takes the Net Inventory WALK value from the previous month. Any reference in the function of [Stock on Hand] is the firm current value of stock on hand.
Any help would be appreciated! Thank you!
Stock On Hand is always the current month, then Total Receipts and Total Demand for each month. Net Inventory is a measure that is Stock On Hand + Total Receipts - Total Demand. Using the below function, I was able to successfully build out the walk, allowing it to roll by month.
Code:
Net Inventory WALK =
VAR _t =
ADDCOLUMNS(
    WINDOW(
        1,
        ABS,
        0,
        REL,
        ALL('Date Table'[Month Yr Sorted],'Date Table'[Sort]),
        ORDERBY('Date Table'[Sort],ASC)
    ),
    "@currentmonth",
    CALCULATE(
        [Stock On Hand],
        KEEPFILTERS('Date Table'[End of Month]=EOMONTH(TODAY(),0))
    ),
    "@receipt",[Total Receipts],
    "@demand",[Total Demand]
)
RETURN
SUMX(_t,[@currentmonth]+[@receipt]-[@demand])
In the image linked below, I have shown what this Net Inventory WALK function returns AND below that, I showcased what I would prefer it to look like. In the Desired Net Inventory WALK, when a column returns a negative value for Net Inventory WALK, I want it to return as a ZERO. I then want the beginning Stock on Hand for the following month to be a ZERO, instead of negative.
ImageOfTable
For reference, the Stock on Hand WALK function is as shown below, which takes the Net Inventory WALK value from the previous month. Any reference in the function of [Stock on Hand] is the firm current value of stock on hand.
Code:
Stock on Hand WALK =
VAR _t =
ADDCOLUMNS(
    WINDOW(
        1,
        ABS,
        -1,
        REL,
        ALL('Date Table'[Month Yr Sorted],'Date Table'[Sort]),
        ORDERBY('Date Table'[Sort],ASC)
    ),
    "@currentmonth",
    CALCULATE(
        [Stock On Hand],
        KEEPFILTERS('Date Table'[End of Month]=EOMONTH(TODAY(),0))
    ),
    "@receipt",[Total Receipts],
    "@demand",[Total Orders]
)
RETURN
IF(SELECTEDVALUE('Date Table'[End of Month])=EOMONTH(TODAY(),0),
CALCULATE(
    [Stock On Hand],
    KEEPFILTERS('Date Table'[End of Month]=EOMONTH(TODAY(),0))
),
SUMX(_t,[@currentmonth]+[@receipt]-[@demand])
)
Any help would be appreciated! Thank you!