Power BI - share change at different levels of product hierarchy

stsanders1

New Member
Joined
Nov 12, 2022
Messages
3
Office Version
  1. 365
Platform
  1. Windows
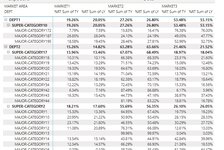
I have 3 markets that account for all sales for current year and last year. I am able to use the % of row calculated field to see the share of each market for each product level, but I am looking to calculate the share change for each market vs. last year for each product level. So for Dept 2 it would be 0.34 (15.26 - 14.82), -0.38 (63.28-63.66) and -0.06 (21.46 - 21.52). Thank you.
 

Attachments

  • Mr. Excel 11-18-22.jpg
    Mr. Excel 11-18-22.jpg
    133.7 KB · Views: 4

Excel Facts

Create a Pivot Table on a Map
If your data has zip codes, postal codes, or city names, select the data and use Insert, 3D Map. (Found to right of chart icons).

Forum statistics

Threads
1,215,153
Messages
6,123,325
Members
449,097
Latest member
gameover8

We've detected that you are using an adblocker.

We have a great community of people providing Excel help here, but the hosting costs are enormous. You can help keep this site running by allowing ads on MrExcel.com.
Allow Ads at MrExcel

Which adblocker are you using?

Disable AdBlock

Follow these easy steps to disable AdBlock

1)Click on the icon in the browser’s toolbar.
2)Click on the icon in the browser’s toolbar.
2)Click on the "Pause on this site" option.
Go back

Disable AdBlock Plus

Follow these easy steps to disable AdBlock Plus

1)Click on the icon in the browser’s toolbar.
2)Click on the toggle to disable it for "mrexcel.com".
Go back

Disable uBlock Origin

Follow these easy steps to disable uBlock Origin

1)Click on the icon in the browser’s toolbar.
2)Click on the "Power" button.
3)Click on the "Refresh" button.
Go back

Disable uBlock

Follow these easy steps to disable uBlock

1)Click on the icon in the browser’s toolbar.
2)Click on the "Power" button.
3)Click on the "Refresh" button.
Go back
Back
Top