JugglerJAF
Active Member
- Joined
- Feb 17, 2002
- Messages
- 297
- Office Version
- 365
- Platform
- Windows
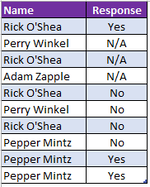
I have a table of data showing calls made by people in the business, so the same name can appear multiple times as each person can make multiple calls. For each call, I have a "response" column which contains a value of either "Yes", "No", or "N/A"
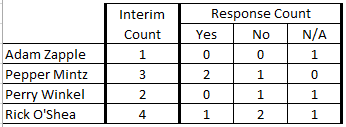
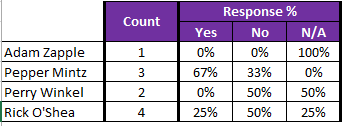
What I'm trying to do (in Power Query) is to generate summary showing the total number of times each person appears (simple enough, I've used "group by" on name and done a count of rows), but I also need for each person the percentage of responses that are "Yes", "No", or "N/A" (the attached "count" image shows an interim count and "percentages" shows the expected output.
I have managed to do this in power query with some test data as shown in in the attached images, but it was very fiddly to do and I'm wondering if there's a better way of approaching this as my actual data is more complex. My solution on the example data was:
- Add in 3 custom columns (Yes Count, No Count and NA Count) using an IF command to replace the value being looked for in each column with 1 and everything else as zero, so in the Yes Count column, all instances of Yes were replaced with 1 and everything else replaced with zero, the No Count column replaced instances of No with 1 and everything else replaced with zero, and so on.
- Once I had the 3 new "count" columns, I could use them in the "group by" command to sum each column which gave me a total count of Yes, No, and N/A for each person
- I then added 3 more custom columns, each with a calculation of: each "count column" value divided by the total number of records for each person to give me the percentage.