Risk matrix chart in Power BI

masterelaichi

New Member
Joined
Sep 29, 2014
Messages
49
Hi,

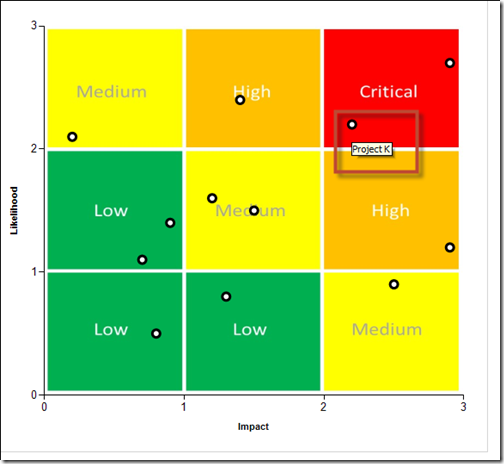
Is it possible to create a risk matrix in Power BI like the one shown in the image? I should be able to slice the charts using the tiles in the matrix. Is there a method to do this?

Any help will be much appreciated

Thanks

large
 

Excel Facts

Whats the difference between CONCAT and CONCATENATE?
The newer CONCAT function can reference a range of cells. =CONCATENATE(A1,A2,A3,A4,A5) becomes =CONCAT(A1:A5)

Forum statistics

Threads
1,215,110
Messages
6,123,146
Members
449,098
Latest member
Doanvanhieu

We've detected that you are using an adblocker.

We have a great community of people providing Excel help here, but the hosting costs are enormous. You can help keep this site running by allowing ads on MrExcel.com.
Allow Ads at MrExcel

Which adblocker are you using?

Disable AdBlock

Follow these easy steps to disable AdBlock

1)Click on the icon in the browser’s toolbar.
2)Click on the icon in the browser’s toolbar.
2)Click on the "Pause on this site" option.
Go back

Disable AdBlock Plus

Follow these easy steps to disable AdBlock Plus

1)Click on the icon in the browser’s toolbar.
2)Click on the toggle to disable it for "mrexcel.com".
Go back

Disable uBlock Origin

Follow these easy steps to disable uBlock Origin

1)Click on the icon in the browser’s toolbar.
2)Click on the "Power" button.
3)Click on the "Refresh" button.
Go back

Disable uBlock

Follow these easy steps to disable uBlock

1)Click on the icon in the browser’s toolbar.
2)Click on the "Power" button.
3)Click on the "Refresh" button.
Go back
Back
Top