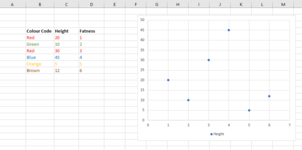
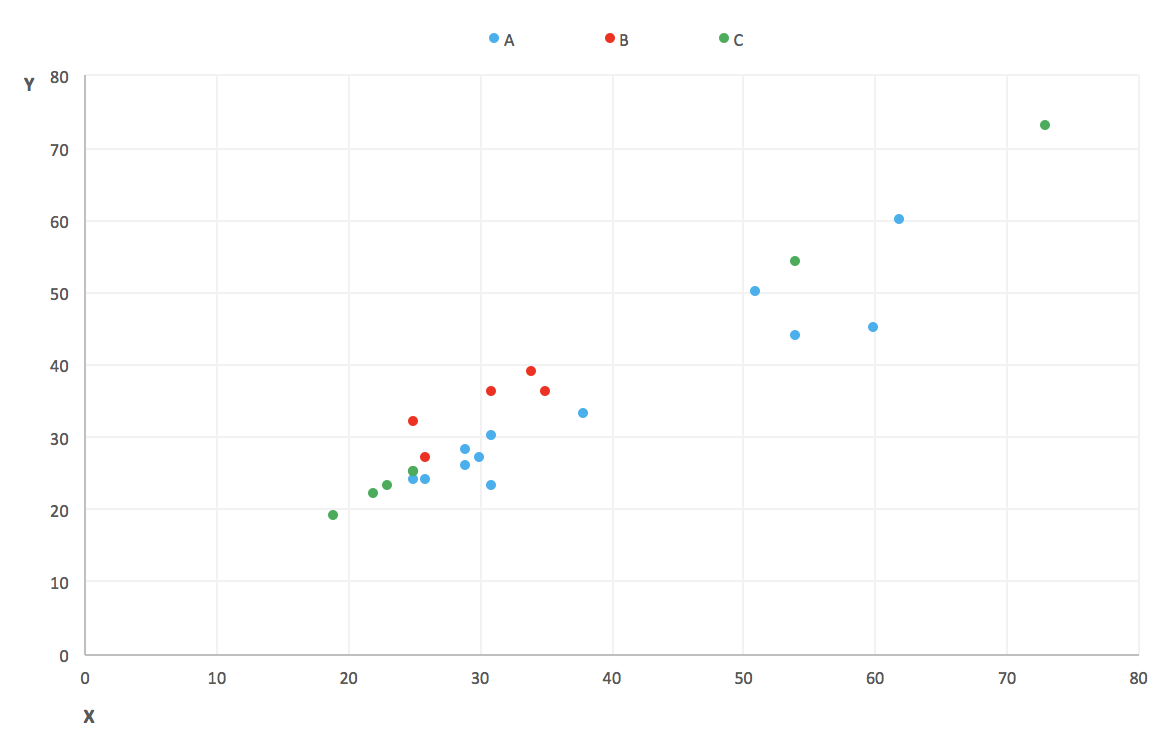
Scatter points on charts to display colour of numbers in data cell

dewotorf

New Member
Joined
Feb 25, 2021
Messages
19
Office Version
  1. 365
Platform
  1. Windows
How do i get scatter points in excel charts to display the colour of the reference data. For example in the attached, how do I get all cells coloured red to display the scatter bubble as red, green for cells with green etc.
 

Attachments

  • scatter colour.PNG
    scatter colour.PNG
    19 KB · Views: 6

Excel Facts

When they said...
When they said you are going to "Excel at life", they meant you "will be doing Excel your whole life".

Forum statistics

Threads
1,215,432
Messages
6,124,858
Members
449,194
Latest member
HellScout

We've detected that you are using an adblocker.

We have a great community of people providing Excel help here, but the hosting costs are enormous. You can help keep this site running by allowing ads on MrExcel.com.
Allow Ads at MrExcel

Which adblocker are you using?

Disable AdBlock

Follow these easy steps to disable AdBlock

1)Click on the icon in the browser’s toolbar.
2)Click on the icon in the browser’s toolbar.
2)Click on the "Pause on this site" option.
Go back

Disable AdBlock Plus

Follow these easy steps to disable AdBlock Plus

1)Click on the icon in the browser’s toolbar.
2)Click on the toggle to disable it for "mrexcel.com".
Go back

Disable uBlock Origin

Follow these easy steps to disable uBlock Origin

1)Click on the icon in the browser’s toolbar.
2)Click on the "Power" button.
3)Click on the "Refresh" button.
Go back

Disable uBlock

Follow these easy steps to disable uBlock

1)Click on the icon in the browser’s toolbar.
2)Click on the "Power" button.
3)Click on the "Refresh" button.
Go back
Back
Top