auto.pilot
Well-known Member
- Joined
- Sep 27, 2007
- Messages
- 734
- Office Version
- 365
- Platform
- Windows
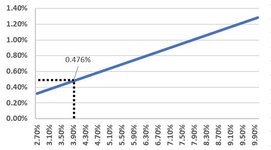
I am seeking a method to automate the black dotted lines within a graph and add only the data label for the intersection between two points along the blue line. Example: When the bottom scale is at 3.90, the left scale is 0.476%. I'd like to automatically add the black dashed horizontal and vertical lines and add the data label. Currently, adding the dashed lines is a very manual process. In addition, it's very difficult to isolate the intersection and add a data label because there are so many points along the line.
How can I do this?
How can I do this?