Show Percentage and Column Total in Chart

robert0803

Board Regular
Joined
Aug 3, 2005
Messages
115
Anyway to show the percentage of the column total in the inside bar graph but keep the values in the lower portion of the chart?

Looking at the "ATLA" column I need the percentage of each category to show in the above graph bars?

Thanks in advance.


cIOMKTQ.jpg


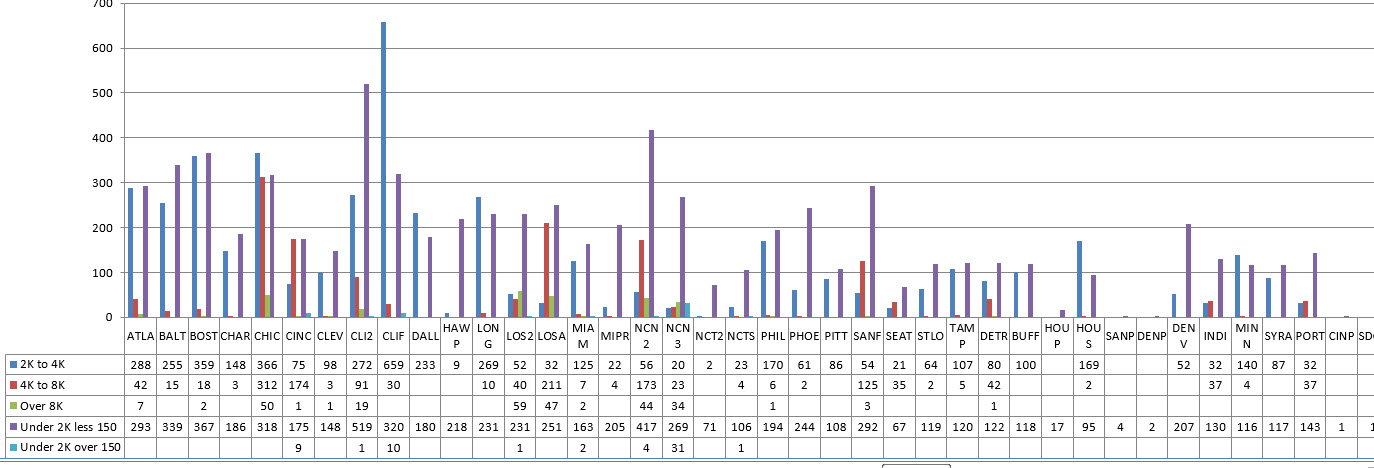
Would love for the bar graphs to show percentages like so below, but still keep the values in the columns above.
bnuBka7.jpg
 
Last edited:

Excel Facts

Excel motto
Not everything I do at work revolves around Excel. Only the fun parts.

Forum statistics

Threads
1,214,920
Messages
6,122,276
Members
449,075
Latest member
staticfluids

We've detected that you are using an adblocker.

We have a great community of people providing Excel help here, but the hosting costs are enormous. You can help keep this site running by allowing ads on MrExcel.com.
Allow Ads at MrExcel

Which adblocker are you using?

Disable AdBlock

Follow these easy steps to disable AdBlock

1)Click on the icon in the browser’s toolbar.
2)Click on the icon in the browser’s toolbar.
2)Click on the "Pause on this site" option.
Go back

Disable AdBlock Plus

Follow these easy steps to disable AdBlock Plus

1)Click on the icon in the browser’s toolbar.
2)Click on the toggle to disable it for "mrexcel.com".
Go back

Disable uBlock Origin

Follow these easy steps to disable uBlock Origin

1)Click on the icon in the browser’s toolbar.
2)Click on the "Power" button.
3)Click on the "Refresh" button.
Go back

Disable uBlock

Follow these easy steps to disable uBlock

1)Click on the icon in the browser’s toolbar.
2)Click on the "Power" button.
3)Click on the "Refresh" button.
Go back
Back
Top