Sub ScaleShape()
Dim Sections As Integer
Dim ShapeScale As Single
Dim Diam As Single
Dim Length As Single
Dim OvrLength As Single
Dim Pixel As Single
Dim LeftVal As Single
Dim TopVal As Single
Dim Centre As Single
Dim TopBar As Single
Dim InfoText As String
With Application
.ScreenUpdating = False
End With
LeftVal = 288
TopVal = 300
OvrLength = LeftVal
Pixel = 2.834646 'Height of 1mm on my screen
ShapeScale = Sheet1.Range("D2").Value
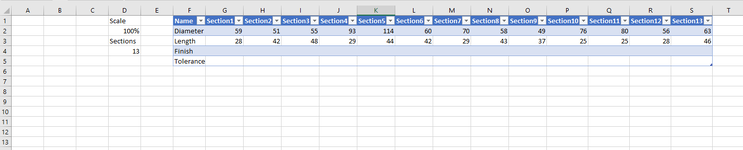
Sections = Sheet1.Range("D4").Value
Diam = Sheet1.Range("F2").Offset(0, 1).Value * Pixel * ShapeScale
Length = Sheet1.Range("F3").Offset(0, 1).Value * Pixel * ShapeScale
Centre = (WorksheetFunction.Max(Range("F2").Resize(1, Sections)) * Pixel / 2) + TopVal
With ActiveSheet
'Delete all shapes that start with "Del"
For Each Shape In .Shapes
If Shape.Name Like "Del*" Then
Shape.Delete
End If
Next Shape
'Add Yellow Rectangle, only once...
For Each Shape In .Shapes
If Shape.Name = "Rectangle Yellow" Then Flag = 1
Next Shape
If Flag > 0 Then
Else
ActiveSheet.Shapes.AddShape(msoShapeRectangle, 1, 1, 1, 1).Name = "Rectangle Yellow"
End If
With ActiveSheet.Shapes.Range(Array("Rectangle Yellow"))
.Left = OvrLength - 75
.Top = TopVal
.Height = (WorksheetFunction.Max(Range("F2").Resize(1, Sections)) * Pixel)
.Width = 40
.Line.Visible = msoFalse
.Fill.ForeColor.RGB = RGB(255, 255, 0)
End With
'Add Left Bar only once....
For Each Shape In .Shapes
If Shape.Name = "ConnectorL" Then Flag = 1
Next Shape
If Flag > 0 Then
Else
.Shapes.AddConnector(msoConnectorStraight, 1, 1, 1, 1).Name = "ConnectorL"
End If
With ActiveSheet.Shapes.Range(Array("ConnectorL"))
.Line.ForeColor.RGB = RGB(0, 0, 0)
.Height = 80
.Top = TopVal - 100
.Left = OvrLength
End With
'Loop through add and move shapes based on number of sections...
Dim i
For i = 1 To Sections
Sheet1.Range("F2").Offset(0, i).Select
Diam = Sheet1.Range("F2").Offset(0, i).Value * Pixel * ShapeScale
Length = Sheet1.Range("F3").Offset(0, i).Value * Pixel * ShapeScale
.Shapes.AddShape(msoShapeRectangle, 1, 1, 1, 1).Name = "Del Rect Sect " & i
With ActiveSheet.Shapes.Range(Array("Del Rect Sect " & i))
.Left = OvrLength
.Top = Centre - (Diam / 2)
.Height = Diam
.Width = Length
.Fill.ForeColor.ObjectThemeColor = msoThemeColorAccent1
.Fill.BackColor.ObjectThemeColor = msoThemeColorBackground1
.Fill.Patterned msoPattern5Percent
.Fill.Patterned msoPatternDarkUpwardDiagonal
.Fill.ForeColor.ObjectThemeColor = msoThemeColorText1
End With
.Shapes.AddConnector(msoConnectorStraight, 1, 1, 1, 1).Name = "Del Arrows Sect" & i
With ActiveSheet.Shapes.Range(Array("Del Arrows Sect" & i))
.Line.BeginArrowheadStyle = msoArrowheadTriangle
.Line.EndArrowheadStyle = msoArrowheadTriangle
.Line.ForeColor.RGB = RGB(0, 0, 0)
.Top = TopVal - 100
.Left = OvrLength
.Width = Length
End With
.Shapes.AddConnector(msoConnectorStraight, 1, 1, 1, 1).Name = "Del ConnectorR Sect " & i
With ActiveSheet.Shapes.Range(Array("Del ConnectorR Sect " & i))
.Line.ForeColor.RGB = RGB(0, 0, 0)
.Height = 80
.Top = TopVal - 100
.Left = OvrLength + Length
End With
.Shapes.AddTextbox(msoTextOrientationHorizontal, 1, 1, 1, 1).Name = "Del TextBox Sect Len" & i
With ActiveSheet.Shapes.Range(Array("Del TextBox Sect Len" & i))
.Width = Len(Sheet1.Range("F3").Offset(0, i).Value) * 15
.Height = 30
.Top = TopVal - 100 - (.Height / 2)
.Left = (Length / 2) + OvrLength - (.Width / 2)
.Line.Visible = msoFalse
With .TextFrame2
.TextRange.Characters.Text = Sheet1.Range("F3").Offset(0, i).Value
.TextRange.Font.Size = 14
.TextRange.ParagraphFormat.Alignment = msoAlignCenter
.VerticalAnchor = msoAnchorMiddle
End With
End With
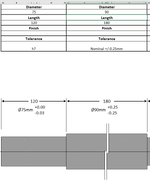
InfoText = "Ø" & Sheet1.Range("F2").Offset(0, i).Value & "mm" & vbCrLf & "+/-" & Sheet1.Range("F5").Offset(0, i).Value
.Shapes.AddTextbox(msoTextOrientationHorizontal, 1, 1, 1, 1).Name = "Del TextBox Sect Dia" & i
With ActiveSheet.Shapes.Range(Array("Del TextBox Sect Dia" & i))
.Width = Length 'Len(Sheet1.Range("F2").Offset(0, i).Value) * 15
.Height = 50
.Top = TopVal - 60 - (.Height / 2)
.Left = (Length / 2) + OvrLength - (.Width / 2)
.Line.Visible = msoFalse
.Fill.Visible = msoFalse
With .TextFrame2
.TextRange.Characters.Text = InfoText
.TextRange.Font.Size = 10
.TextRange.ParagraphFormat.Alignment = msoAlignCenter
.VerticalAnchor = msoAnchorMiddle
End With
End With
OvrLength = OvrLength + Length
Next i
'End of Loop
'Add Centreline, only once...
For Each Shape In .Shapes
If Shape.Name = "Connector Centre" Then Flag = 1
Next Shape
If Flag > 0 Then
Else
ActiveSheet.Shapes.AddConnector(msoConnectorStraight, 1, 1, 1, 1).Name = "Connector Centre"
End If
With ActiveSheet.Shapes.Range(Array("Connector Centre"))
.Line.ForeColor.RGB = RGB(0, 0, 0)
.Left = LeftVal - 30
.Width = OvrLength - 220
.Top = Centre
.ZOrder msoBringToFront
End With
End With
With Application
.ScreenUpdating = True
End With
End Sub