Solver formula

Solverer

New Member
Joined
Apr 27, 2020
Messages
10
Office Version
  1. 2013
Platform
  1. Windows
Hello Guys!
I have a question how to transform non-linear function like this =IF(AND(J7(600 000)>F7(fixed amount), D79(Current data)>L6(3%),D79<M6(4%)),M7(0.06),IF(AND(J7(600 000)>F7, D79(Current result)>M6(4%), D79<L6(5%)),L7(0.07) to the linear one, so I will be able to use the simplex method to solve the problem and not the evolutionary.
This is the maximising problem the data looks like this. The upper data is the ranges. so you will have 0.06 if the data less than 4% and more than 3% and the total amount is less than 600 000
2.0000%3.0000%4.0000%5.0000%6.0000%7.0000%8.0000%9.0000%10.0000%
6000000.040.050.060.0710.000.070.060.050.04
20000000.040.050.060.0712.000.070.060.050.04
 
Thank you KRice for your help!
Your formula really helps. I got now the limitation of this problem.
 
Upvote 0

Excel Facts

Square and cube roots
The =SQRT(25) is a square root. For a cube root, use =125^(1/3). For a fourth root, use =625^(1/4).
An alternative way to investigate this is to create a large table that covers the entire solution space and then use some visualization method to examine the results. In this case, I did this in two steps, but it could be streamlined somewhat. I first built a table describing the potential solution space. The body of the table is on sheet Data1 located at Data1!M13:HE213. From top to bottom, the rows represent seller 1 (S1) additional incentive products ranging from 0 (top) to 100,000 (bottom) in increments of 500. From left to right, the columns represent the sum of additional incentive products for both sellers (S1 + S2), ranging from 100,000 (left "M" column) to 0 (right, "HE" column), in decrements of 500. The body of the Data1 table then shows the number of additional incentive products for seller 2 (S2) that correspond to the column (total sum) given the S1 value of that row.

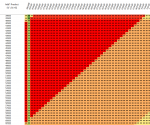
Then on another sheet called "HeatMap1", the S1 and S2 values in the "Data1" table are used to compute the sum of bonuses that would be awarded to each seller, and this calculation is done using the formula described previously (used twice...first to generate the bonus for seller 1 and again to generate the bonus for seller 2). Then conditional formatting was applied using 3-color formatting based on cell value, with the low global value assigned green, 40th percentile assigned yellow, and the high global value (170) assigned red. Then row and column sizes were shrunk to better visualize the entire space, producing this result:
heatmap1.png

If you look closely, you'll see a narrow vertical red bar about halfway down the left side, and to its right is a nearly complete red right triangle. Those areas correspond to optimal solutions; and zooming in on those areas looks like this.
heatmap1_zoom.png


The color rendering of this image may not display accurately, as the top two rows (S1=39000 & 39500) are red-orange. The upper edge of the red triangle corresponds to S1=40000. Earlier we found an optimal solution by guessing outside of this space and relying on Solver to satisfy the constraint (S1+S2 <= 100000). The solution returned was S1=49500 and S2=49500. That point can be seen in the red triangle, but as you can see, there are many optimal solutions. For example S1=40000 and S1+S2=80000 (so S2=40000) can be seen at the upper right of the triangle at a "triple point" where three colors intersect. The implication is that 1 unit step to the right, up or down will result in falling off the maximum value. This can be investigated in the earlier worksheet by setting (S1,S2)=(40000,40000)(an optimal solution) and then changing to (39999,40001) (up on this chart) or (40000,39999) (right), or (40001,39999) (down), and we see that these very small shifts can have dramatic consequences and yield suboptimal results.

It is unlikely that typical optimization algorithms will reliably find these maximum plateaus; and I don't believe there are practical ways to reformulate the problem. You may want to consider this type of mapping approach to identify optimal solutions. To facilitate adapting this to your current or future needs, the workbook I used is available here:
 

Attachments

  • heatmap1_zoom.png
    heatmap1_zoom.png
    61.4 KB · Views: 3
Upvote 0
Wow! It is really cool! Thank you for such spreadsheet and for your effort in helping to solve this problem!
 
Upvote 0
You're welcome. I'm happy to help.

You might try investigating other optimization engines, but this approach to map the entire solution space might be the preferred option. I haven't investigated this any further, but you might be able to reduce the size of the heat map table. Since the two components in each cell of the heat map are bonuses based on sales volume percentage relative to the initial volume, and you know the size of the steps in the bonus award table, you could probably use larger increments in the heat map table and still not "miss" an optimal solution. For example, the smallest initial volume was 200,000 for seller 2, and the maximum bonus constraint is 100,000, so a heat map increment size of 500 for 200 columns means that seller 2 covers a range of 30% (their initial location in the bonus award table because they sold 60,000/200,000 = 0.30) up to 80% (assuming that all of the additional incentive products available were sold only by seller 2...(60,000+100,000)/200,000 = 0.80)), and each step in the heat map table then corresponds to 500 units of product or 0.25% (and even smaller amounts for seller 1). The point is that larger increment sizes over fewer rows and columns could probably be used to make the table size somewhat more manageable, but whether this makes sense very much depends on the specific scenario presented.
 
Upvote 0
Yes with the heat map is really helpful in finding the right solution, however, do you think the heat map will be able to handle 64 different variables and 64 constraints ?
 
Upvote 0
Ouch!...no, probably not since the map plots the entire solution space for two sellers (variables), and that lends itself to a two-dimensional relationship with one seller along the x-axis and the other seller along the y-axis...and each table body cell holds the value, or sum of the bonus amounts (or elevation, if you want to think about this in terms of a collapsed or flattened 3D representation). With 64 variables, this type of visualization isn't possible; however, the general approach may still be doable with some modifications. What does the expanded version look like? Is it a similar problem in that there are 64 sellers, each with their own initial volumes of product sold and there is some total volume of additional product that could be sold among any combination of the 64 sellers...and you would like to determine which combination(s) of sellers and additional incentive sales volumes produce the largest bonus? And all sellers are subject to the same sales volume percentage - bonus table described earlier? Or is the 64-variable problem something else?
 
Upvote 0
I apologise for the long reply.
The problem is similar to the original one but with 64 seller. Every seller has his own bonus and product. However, they are divided in groups. In one group there are 8 sellers. The sum of the additional product of each seller in the group should not exceed the certain amount for that group.

And all sellers are subject to the same sales volume percentage - bonus table described earlier?
Yes, it is the same
 
Upvote 0
It sounds as if you have 8 groups, and each group consists of 8 sellers. If we focus on only one group for the moment, each of the 8 sellers within that group have some known "sold to date" quantity and they have the potential to earn bonus money by selling additional product. The bonus amount is determined from the table and rules described earlier. If I understand you correctly, the constraint that applies to this group is that the total sum of additional product sold by these 8 eight sellers cannot exceed some quantity?

Now what happens when we consider the next group of 8 sellers. It sounds as if this group may have a similar constraint on the total amount of additional product that they can collectively sell, but the amount may differ from the first group. Can you confirm that this is the case.

So are there any other constraints then that tie the performance of one group of 8 sellers to the performance of another group of 8 sellers. For example, can one group not earn more than x times another group? Or is there a constraint on the total amount of incentive product that can be apportioned between the 8 groups? If not, then couldn't this 64 seller problem be reduced to an 8 seller problem that would be repeated 8 times (once for each group)?
 
Upvote 0
If I understand you correctly, the constraint that applies to this group is that the total sum of additional product sold by these 8 eight sellers cannot exceed some quantity?
Yes this is correct

Now what happens when we consider the next group of 8 sellers. It sounds as if this group may have a similar constraint on the total amount of additional product that they can collectively sell, but the amount may differ from the first group. Can you confirm that this is the case.
This is also correct

Can one group not earn more than x times another group?
This is not the case

Unfortunately it is not possible to reduce to 8 sellers problems since each seller has its own unique parameter which affect the whole group. As I understand it is not currently possible to do such thing in excel so it could be easily scaled and automated.
I really appreciate your help at such difficult question KRice ! You significantly contributed in the understanding of such question.
 
Upvote 0

Forum statistics

Threads
1,215,049
Messages
6,122,864
Members
449,097
Latest member
dbomb1414

We've detected that you are using an adblocker.

We have a great community of people providing Excel help here, but the hosting costs are enormous. You can help keep this site running by allowing ads on MrExcel.com.
Allow Ads at MrExcel

Which adblocker are you using?

Disable AdBlock

Follow these easy steps to disable AdBlock

1)Click on the icon in the browser’s toolbar.
2)Click on the icon in the browser’s toolbar.
2)Click on the "Pause on this site" option.
Go back

Disable AdBlock Plus

Follow these easy steps to disable AdBlock Plus

1)Click on the icon in the browser’s toolbar.
2)Click on the toggle to disable it for "mrexcel.com".
Go back

Disable uBlock Origin

Follow these easy steps to disable uBlock Origin

1)Click on the icon in the browser’s toolbar.
2)Click on the "Power" button.
3)Click on the "Refresh" button.
Go back

Disable uBlock

Follow these easy steps to disable uBlock

1)Click on the icon in the browser’s toolbar.
2)Click on the "Power" button.
3)Click on the "Refresh" button.
Go back
Back
Top