Hi
I have a spreadsheet of data which I would like to use to create several line charts (one for each row).
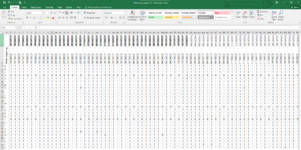
At moment there is a column for every date and value is either 1 or 0. I have added a row to calculate week beginning for every date. Would like a count of each week's values for each row and then to create a chart from this summary.
I tried subtotal but could not get it to achieve what I'm looking for.
My spreadsheet can be seen below.
I have a spreadsheet of data which I would like to use to create several line charts (one for each row).
At moment there is a column for every date and value is either 1 or 0. I have added a row to calculate week beginning for every date. Would like a count of each week's values for each row and then to create a chart from this summary.
I tried subtotal but could not get it to achieve what I'm looking for.
My spreadsheet can be seen below.