Trigger MouseMove Event on Deselected Charts ?

Jaafar Tribak

Well-known Member
Joined
Dec 5, 2002
Messages
9,621
Office Version
  1. 2016
Platform
  1. Windows
Hi all,

As you know, worksheet embedded Charts have a MouseMove event which is fired when the mouse is moved over the
active, or selected, chart (The event does not fire if the chart is not selected)

This is so messy and counter-intuitive and can cause a number of issues specially screen flickering.

I wonder if there was ever a workaround solution to this problem .. I have looked on the web but couldn't find a solution.

Does anyone know ?

Regards.


Code:
Private WithEvents chrt As Chart

Private Sub HookChartEvents()
    Set chrt = Sheet1.ChartObjects(1).Chart
End Sub

Private Sub chrt_MouseMove(ByVal Button As Long, ByVal Shift As Long, ByVal x As Long, ByVal y As Long)
    MsgBox "Mouse Moved Over Chart."
End Sub
 

Excel Facts

What is the fastest way to copy a formula?
If A2:A50000 contain data. Enter a formula in B2. Select B2. Double-click the Fill Handle and Excel will shoot the formula down to B50000.
One way
Add a transparent active-x label (made larger than the chart) behind the chart and use its mouseover to activate the chart

Method
- add an Active-X label to the worksheet
- place that label over the chart
- resize the label and make it slightly larger than the chart
- change backstyle property to fmBackStyleTransparent
- delete default text
- place label behind the chart (right-click on label \ order \ send to back)
- use the label's mousemove event to activate your chart (code below)

In sheet module
Code:
Private Sub [COLOR=#ff0000]Label1[/COLOR]_MouseMove(ByVal Button As Integer, ByVal Shift As Integer, ByVal X As Single, ByVal Y As Single)
    ActiveSheet.ChartObjects("[COLOR=#ff0000]Chart 1[/COLOR]").Select
End Sub

Notes
- red values need to match the names of the objects in your worksheets
- the label could be placed to one side of the chart if you prefer - what matters is to enable mouseover the label to activate your chart or to call another macro
 
Last edited:
Upvote 0
I should have finished off the above post with this to fully answer your question :)

In the sheet module
Code:
Private WithEvents chrt As Chart

Private Sub Label1_MouseMove(ByVal Button As Integer, ByVal Shift As Integer, ByVal x As Single, ByVal y As Single)
    Set chrt = ActiveSheet.ChartObjects(1).Chart
End Sub
Private Sub chrt_MouseMove(ByVal Button As Long, ByVal Shift As Long, ByVal x As Long, ByVal y As Long)
    MsgBox "Mouse Moved Over Chart."
End Sub
 
Upvote 0
One way
Add a transparent active-x label (made larger than the chart) behind the chart and use its mouseover to activate the chart

Method
- add an Active-X label to the worksheet
- place that label over the chart
- resize the label and make it slightly larger than the chart
- change backstyle property to fmBackStyleTransparent
- delete default text
- place label behind the chart (right-click on label \ order \ send to back)
- use the label's mousemove event to activate your chart (code below)

In sheet module
Code:
Private Sub [COLOR=#ff0000]Label1[/COLOR]_MouseMove(ByVal Button As Integer, ByVal Shift As Integer, ByVal X As Single, ByVal Y As Single)
    ActiveSheet.ChartObjects("[COLOR=#ff0000]Chart 1[/COLOR]").Select
End Sub

Notes
- red values need to match the names of the objects in your worksheets
- the label could be placed to one side of the chart if you prefer - what matters is to enable mouseover the label to activate your chart or to call another macro

Thanks Yongle,

I have seen this ActiveX Label workaround used before in similar scenarios and on shapes that do not natively fire mouse events.

Unfortunately, this would only work for entering the chart area on the condition that the label is slightly wider than the chart and its edges spill outside the chart... This won't work when over the chart however.

Another issue is that adding a label looks kind of messy and if the label was to be added at runtime, it would reset the project and would inadvertently clear all the project variables .. it would be like executing the End statement... Not good.

And perhaps the major problem is that if one was to place the GetChartElement Method inside the Label Control mousemove event , the Method wouldn't return the correct values such as the ElementId, arg1 and arg2 which are based on the x and y parameters of the chart mousemove event.

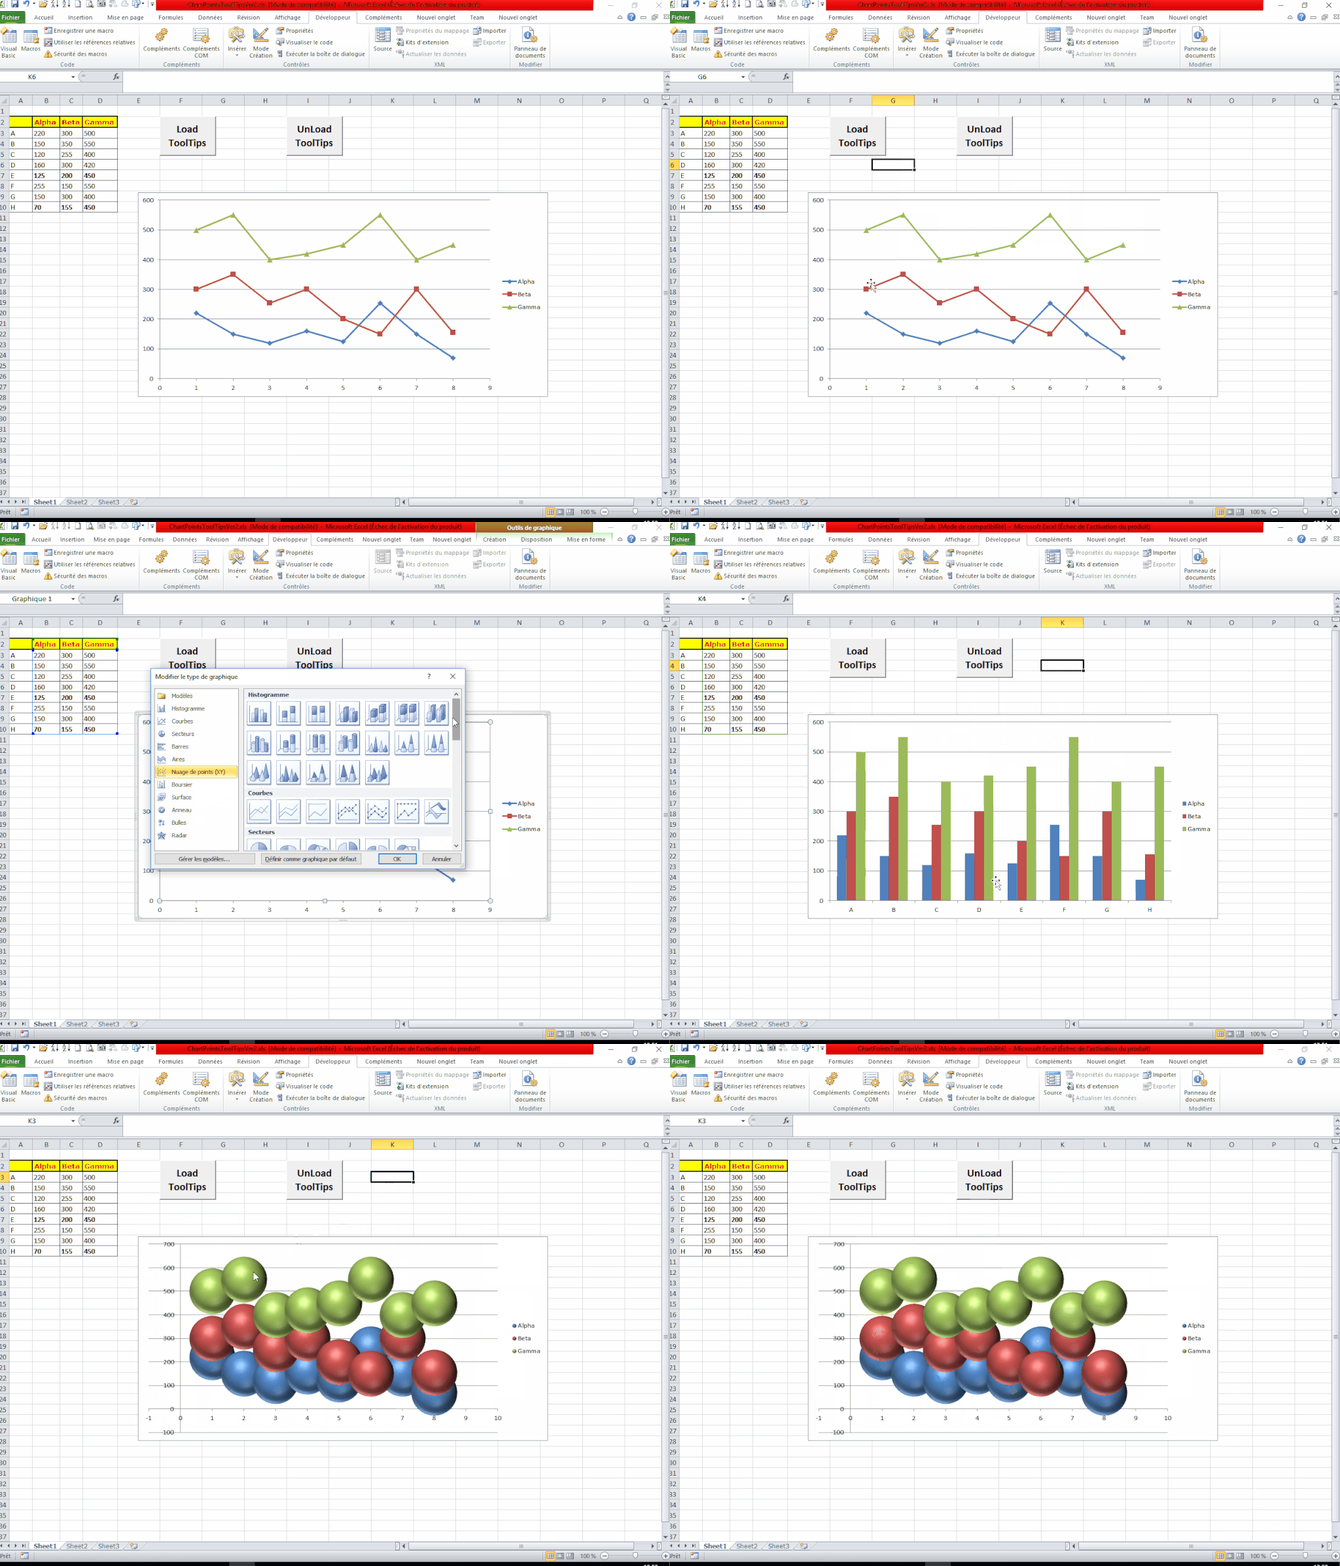
My ultimate goal is to be able to display custom screen tooltips for each individual datapoint on each chart serie.

I have managed to do this in a recent post here but at the moment, it only works for linear charts with one data serie only. (not with multi-series charts).

I was hoping to make this more generic and work for datapoints on all types of charts and on charts with more than one data serie that's why I need to make use of the GetChartElement Method but obviously without having to priorly select the chart.

I am working on something at the moment which looks promising and hopefully it will work and I'll post it later.

Regards.
 
Last edited:
Upvote 0
I look forward to reading your solution - it is always good to see alternative workarounds :)

Instead of putting the label behind the chart..why not..
- put it in front of the chart
- make it smaller than the chart (allowing you to select the chart if required)
- use label mouseover to select the chart
- move label to back
- the chart mouseover should trigger
- move label to front when you move away from chart

Why should adding a label at runtime "clear all project variables"?

That is very messy plus you would still need to select the chart in order to make the GetChartElement Method work for obtaining the correct chart elements under the mouse pointer.

Why should adding a label at runtime "clear all project variables"?

Adding a label at runtime via code will cause the project to be reset just as adding it via the user interface .. Try it and you will see.
 
Last edited:
Upvote 0
That is very messy plus you would still need to select the chart in order to make the GetChartElement chart Method work for obtaining the correct chart elements under the mouse pointer.
I am obviously being slow today. What am I missing :confused:
This is my logic - Label mouseover triggers label to move out of the way AND select the chart WHICH enables BOTH chart mouseover AND GetChartElement method

Why does label need to be added at runtime?
- why not add label when chart is created (thus avoiding variable reset issue)
 
Last edited:
Upvote 0
I am obviously being slow today. What am I missing :confused:
This is my logic - Label mouseover triggers label to move out of the way AND select the chart WHICH enables BOTH chart mouseover AND GetChartElement method

Why does label need to be added at runtime?
- why not add label when chart is created (thus avoiding variable reset issue)

You can indeed add the label at design time but I wanted to make it more automatic which would make the code more self-contained and portable.

But adding the label at runtime or at design time is not my main issue here .. The issue here is that I don't want to have to select the chart before being able to fire the chart's mousemove event and execute the GetChartElement method .. With your label idea, you will still need to select the chart via code.

Having to select the chart is in my humble opinion messy, counter-intutive and more importantly, it causes horrible flickering when adding custom tooltips :)

Regards.

Late Note:
Just tested your idea and there is another major problem with adding a transparent label which is the fact that you can no longer click the chart

 
Last edited:
Upvote 0
Late Note:
Just tested your idea and there is another major problem with adding a transparent label which is the fact that you can no longer click the chart
- more of an "irritation" than a "major problem" :)
- use Label click event to select the chart

Conclusion
I think all the negatives except one can be resolved to provide a good solution.
- the "horrible flickering" is the "blocker"

Hopefully your alternative approach will get you there. Don't forget to post it.
regards
Y
 
Last edited:
Upvote 0
Ok here is a preview .. Will post code next


Last edited:
Upvote 0

Forum statistics

Threads
1,215,356
Messages
6,124,475
Members
449,164
Latest member
Monchichi

We've detected that you are using an adblocker.

We have a great community of people providing Excel help here, but the hosting costs are enormous. You can help keep this site running by allowing ads on MrExcel.com.
Allow Ads at MrExcel

Which adblocker are you using?

Disable AdBlock

Follow these easy steps to disable AdBlock

1)Click on the icon in the browser’s toolbar.
2)Click on the icon in the browser’s toolbar.
2)Click on the "Pause on this site" option.
Go back

Disable AdBlock Plus

Follow these easy steps to disable AdBlock Plus

1)Click on the icon in the browser’s toolbar.
2)Click on the toggle to disable it for "mrexcel.com".
Go back

Disable uBlock Origin

Follow these easy steps to disable uBlock Origin

1)Click on the icon in the browser’s toolbar.
2)Click on the "Power" button.
3)Click on the "Refresh" button.
Go back

Disable uBlock

Follow these easy steps to disable uBlock

1)Click on the icon in the browser’s toolbar.
2)Click on the "Power" button.
3)Click on the "Refresh" button.
Go back
Back
Top