mountainman88
Board Regular
- Joined
- Jun 22, 2019
- Messages
- 109
- Office Version
- 2016
- Platform
- Windows
I found this great article for creating a UDF to manipulate charts and it works great.
 exceloffthegrid.com
How can I modify this to create a UDF where I can link 1) chart title where the UDF argument is a cell 2) The data range for the chart,where the UDF argument is a range of cells (this would be the same as the data source range when setting up the chart)
Thanks!
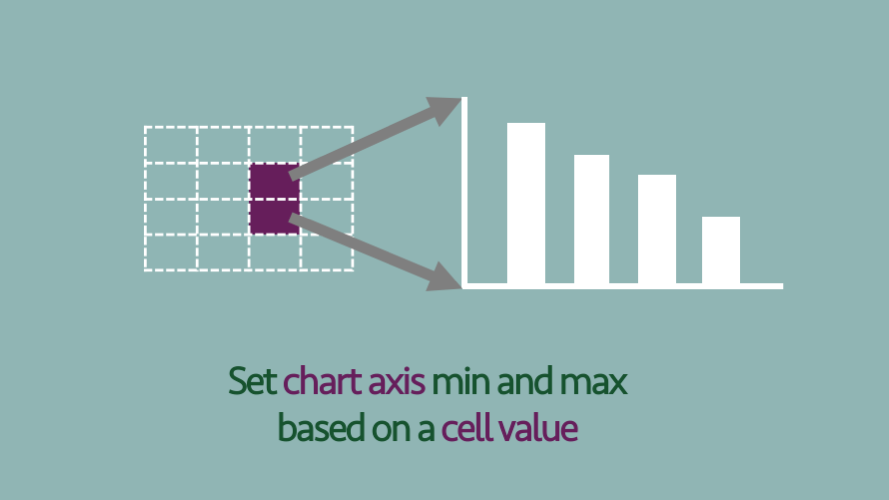
How to set chart axis based on a cell value
The chart axis min and max settings are fixed values. This posts looks at a automated method to set chart axis based on a cell value.
exceloffthegrid.com
How can I modify this to create a UDF where I can link 1) chart title where the UDF argument is a cell 2) The data range for the chart,where the UDF argument is a range of cells (this would be the same as the data source range when setting up the chart)
Thanks!


