Using Master Parts List for Multiple files

dominical

New Member
Joined
May 9, 2023
Messages
2
Office Version
  1. 365
Platform
  1. Windows
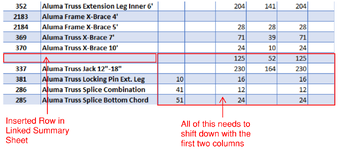
I have a parts list that will be used in multiple tables. I have a separate file for each location and a file with the overall summary of inventory, if we buy a new item I want to be able to add it to the summary sheet at any row (as they grouped by similar parts) and it populate the other files for each location. Only the first two columns of each row is identical the others are formulas or data that need to adjust to the insertion of a new row. I can get the first two rows to update but the other columns remain unchanged which means they are now referring to the wrong part and wrong formula. Below is an example of one of the tables, they will all have a varying number of columns but the same number of rows. Please let me know if this is possible and how.
1683654740135.png
 

Excel Facts

Round to nearest half hour?
Use =MROUND(A2,"0:30") to round to nearest half hour. Use =CEILING(A2,"0:30") to round to next half hour.
Starting with separate tables for each site's inventory (they can be in different Workbooks):
Book1
ABCDEFGHIJK
1Item No.DescriptionSite 1Item No.DescriptionSite 2Item No.DescriptionSite 3
25127Dolly Transporting5127Dolly Transporting5127Dolly Transporting
3266Truss Nylon Sling 6'1266Truss Nylon Sling 6'266Truss Nylon Sling 6'
46121Truss Lower/Lift Jack 4' MKII66121Truss Lower/Lift Jack 4' MKII6121Truss Lower/Lift Jack 4' MKII
517Aluma Beam 21'9817Aluma Beam 21'3417Aluma Beam 21'5
671Aluma Beam 20'271Aluma Beam 20'171Aluma Beam 20'
769Aluma Beam 19'69Aluma Beam 19'69Aluma Beam 19'
811Aluma Beam 18'41811Aluma Beam 18'3411Aluma Beam 18'28
968Aluma Beam 17'168Aluma Beam 17'68Aluma Beam 17'
1012Aluma Beam 16'2612Aluma Beam 16'4712Aluma Beam 16'61
1167Aluma Beam 15'2867Aluma Beam 15'4267Aluma Beam 15'
1214Aluma Beam 14'2214Aluma Beam 14'2314Aluma Beam 14'2
1366Aluma Beam 13'10766Aluma Beam 13'166Aluma Beam 13'1
1416Aluma Beam 12'18716Aluma Beam 12'216Aluma Beam 12'9
1563Aluma Beam 11'763Aluma Beam 11'1363Aluma Beam 11'1
1615Aluma Beam 10'-6"515Aluma Beam 10'-6"515Aluma Beam 10'-6"1
1762Aluma Beam 10'2862Aluma Beam 10'162Aluma Beam 10'8
1885Aluma Beam 9'285Aluma Beam 9'185Aluma Beam 9'
19115Aluma Beam 8'22115Aluma Beam 8'7115Aluma Beam 8'5
20113Aluma Beam 7'16113Aluma Beam 7'12113Aluma Beam 7'2
21112Aluma Beam 6'112Aluma Beam 6'112Aluma Beam 6'
22111Aluma Beam 5'1111Aluma Beam 5'111Aluma Beam 5'
23109Aluma Beam 4'109Aluma Beam 4'109Aluma Beam 4'
244046A-Clamp Assembly1174046A-Clamp Assembly1,4864046A-Clamp Assembly100
256161HD#2 Post Shores2,2486161HD#2 Post Shores6286161HD#2 Post Shores104
Sheet1

Then append the 3 tables, then group the Item# and Description columns and sum each site, and add to get the total:
Power Query:
let
    Source = Table.Combine({Site1, Site2, Site3}),
    GroupedRows = Table.Group(Source, {"Item No.", "Description"}, {{"Site 1", each List.Sum([Site 1]), type nullable number}, {"Site 2", each List.Sum([Site 2]), type nullable number}, {"Site 3", each List.Sum([Site 3]), type nullable number}}),
    InsertedTotalInventory = Table.AddColumn(GroupedRows, "Total Inventory", each List.Sum({[Site 1], [Site 2], [Site 3]}), type number)
in
    InsertedTotalInventory
Book1
MNOPQR
1Item No.DescriptionSite 1Site 2Site 3Total Inventory
25127Dolly Transporting
3266Truss Nylon Sling 6'11
46121Truss Lower/Lift Jack 4' MKII66
517Aluma Beam 21'98345137
671Aluma Beam 20'213
769Aluma Beam 19'
811Aluma Beam 18'4183428480
968Aluma Beam 17'11
1012Aluma Beam 16'264761134
1167Aluma Beam 15'284270
1214Aluma Beam 14'2223247
1366Aluma Beam 13'10711109
1416Aluma Beam 12'18729198
1563Aluma Beam 11'713121
1615Aluma Beam 10'-6"55111
1762Aluma Beam 10'281837
1885Aluma Beam 9'213
19115Aluma Beam 8'227534
20113Aluma Beam 7'1612230
21112Aluma Beam 6'
22111Aluma Beam 5'11
23109Aluma Beam 4'
244046A-Clamp Assembly11714861001703
256161HD#2 Post Shores22486281042980
Sheet1

Please use XL2BB when posting data.
 
Upvote 0
Thank you for your help but I don't think I explained my problem clearly, I have multiple workbooks with tables that all use power query to get the Item no. and Description from the summary sheet. Each of those tables have many adjacent columns of shipments and returns and those get added up and sent back to summary and that all works fine. The problem is we periodically buy new products and they are grouped by category so when adding new products I would like to be able to insert in the middle of the table. When I do that it only updates the first two columns and shifts everything down except now the remaining columns no longer correspond to the correct product as they are not shifted down to match. It is kind off difficult to explain so I made an illustration.

1683722417469-png.91356
 

Attachments

  • 1683722417469.png
    1683722417469.png
    141.1 KB · Views: 28
Upvote 0

Forum statistics

Threads
1,216,752
Messages
6,132,512
Members
449,731
Latest member
dasda34

We've detected that you are using an adblocker.

We have a great community of people providing Excel help here, but the hosting costs are enormous. You can help keep this site running by allowing ads on MrExcel.com.
Allow Ads at MrExcel

Which adblocker are you using?

Disable AdBlock

Follow these easy steps to disable AdBlock

1)Click on the icon in the browser’s toolbar.
2)Click on the icon in the browser’s toolbar.
2)Click on the "Pause on this site" option.
Go back

Disable AdBlock Plus

Follow these easy steps to disable AdBlock Plus

1)Click on the icon in the browser’s toolbar.
2)Click on the toggle to disable it for "mrexcel.com".
Go back

Disable uBlock Origin

Follow these easy steps to disable uBlock Origin

1)Click on the icon in the browser’s toolbar.
2)Click on the "Power" button.
3)Click on the "Refresh" button.
Go back

Disable uBlock

Follow these easy steps to disable uBlock

1)Click on the icon in the browser’s toolbar.
2)Click on the "Power" button.
3)Click on the "Refresh" button.
Go back
Back
Top