using pie charts

davidmor

New Member
Joined
Nov 20, 2020
Messages
30
Office Version
  1. 365
Platform
  1. Windows
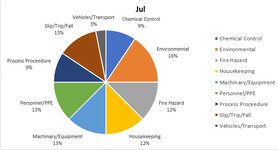
hi all, i hhave a sheet where im compiling data on near misses that data is then seperated into 2 pie charts one for department and the other for category, is there anyway i can have a pie chart or any chart display the info category info per department.
 

Excel Facts

Pivot Table Drill Down
Double-click any number in a pivot table to create a new report showing all detail rows that make up that number
This is what i currently have, but want to be able to fiter by location and have it display the % of each category
1605890048771.png
 
Upvote 0
Hi,
Welcome to the board.
There are a few things missing from your screenshot so I have made a few assumptions
1-Assume the top left cell in your screenshot is cell A1
2-Your 1st Pie chart is reading from F4:G12
3-Cell G4 has a formula, guessing it is something like =COUNTIF($D$2:$D$33,$F4)
4-Unknown length of the range, my example goes down to Row 33 (adjust to suit)

If the above are correct, create a validation drop down list in cell J3 listing all the Locations.

Change the formula in cell G4 to: -
Code:
 =COUNTIFS($D$2:$D$33,$F4,$B$2:$B$33,$J$3)
And copy down

Hope this helps
Paul.

Book1
ABCDEFGHIJK
1DateLocationInfoCategory
201/07/2020Cuttingstuff written hereEnvironmentalLocation
302/07/2020Finishing Cellstuff written hereSlip/Trip/FallCategoryOccurrenceFinishing Cell
402/07/2020Flatworkstuff written hereFire HazardChemical Control0
506/07/2020Cuttingstuff written herePersonnel/PPEEnvironmental1
602/07/2020Finishing Cellstuff written hereMachinary/EquipmentFire Hazard1
702/07/2020Flatworkstuff written hereProcess ProceedureHousekeeping1
813/07/2020Cuttingstuff written hereHousekeepingMachinary/Equipment2
902/07/2020Finishing Cellstuff written hereEnvironmentalPersonnel/PPE1
1002/07/2020Flatworkstuff written hereSlip/Trip/FallProcess Proceedure1
1106/07/2020Cuttingstuff written hereFire HazardSlip/Trip/Fall2
1202/07/2020Finishing Cellstuff written herePersonnel/PPEVehicles/Transport0
1302/07/2020Flatworkstuff written hereMachinary/Equipment
Sheet1
Cell Formulas
RangeFormula
G4:G12G4=COUNTIFS($D$2:$D$33,$F4,$B$2:$B$33,$J$3)
Cells with Data Validation
CellAllowCriteria
J3List=location
 
Upvote 0
Solution
You're welcome.

Just to add:-
If you include the word "All" into the data validation list of locations, you can use the following formula (to cell G4 and copy down), this would give you all the values you had before.

Code:
=IF($J$3="All",COUNTIF($D$2:$D$33,$F4),COUNTIFS($D$2:$D$33,$F4,$B$2:$B$33,$J$3))
 
Upvote 0
Hi Taul, dont suppose i could bother you again, would oi be able to do the same but for multiple sheets,

so have the pie chart able to select the same data by area but based on a few different sheets, i.e all the months listed across the bottom of the sheet

thanks


1606204238233.png
 
Upvote 0
Hi,
I'm not sure that I understand what you need.
I assume you still have dates in column A, your screenshot is missing that column.

Question 1 - Will the data on the other month sheets be similar to the July sheet in terms of layout, albeit different numbers?
Question 2 - Are you asking to have the pie chart on the July sheet read the data from the other months so it can be displayed on the July sheet?

If it is working for July, you could copy the formula over to the other sheets. Actually it is probably easier to right click on the July page tab and select "Move or Copy", tick the little box to "Create a copy" and then paste the new month data to the new sheet. That way, all the month sheets will have a consistent layout.

If you want to stay on the July sheet (or a new front sheet) and just select the month in a drop down, that can be done but the easier option would be to put the years worth of data on the same page, so the pie chart is only reading from one source rather than trying to read from each separate month page.
 
Upvote 0
Hi Taul, i have the date on each month, but would like a collective date for all months combined on a seperate sheet, i have overvivew tabs at the start but they only show the total per department and the total of each type, i would like to be able to have the pie chart work as the previous one so i can select a department and it show the different types and amount of each if possible
 
Upvote 0
ive managed to do it (somehow), the formula i used probably isnt the correct way of doing it but it does the job and displays the requested info, thanks for giving me the begining info that allowed me to try and create what i was after
:)

never thought id get so excited about figuring somehting out in excel lol
 
Upvote 0
Hi,
Great news, sounds like you have caught the Excel bug.
I had a part solution done, so I thought I would post it anyway.
The pie chart is intended to read from Column "U" to display each month as it is selected.
This is based on having all the years worth of data on one page (col A to D), no real need for separate page tabs for each month.
Formula goes down to row 1000, change it if needed.

Filter Pie Chart.xlsx
ABCDEFGHIJKLMNOPQRSTU
1DateLocationInfoCategory
201/07/2020Cuttingstuff hereEnvironmentalLocation
302/07/2020Finishing Cellstuff hereSlip/Trip/FallAll
402/07/2020Flatworkstuff hereFire Hazard
506/07/2020Cuttingstuff hereChemical ControlMonth # =1234567891011127
602/07/2020Finishing Cellstuff hereMachinary/EquipmentCategoryJanFebMarAprMayJunJulAugSepOctNovDecTotalJul
702/07/2020Cuttingstuff hereChemical ControlChemical Control00000030000033
813/07/2020Cuttingstuff hereHousekeepingEnvironmental00000050000055
902/07/2020Finishing Cellstuff hereEnvironmentalFire Hazard00000040000044
1002/07/2020Flatworkstuff hereSlip/Trip/FallHousekeeping00000040000044
1106/07/2020Cuttingstuff hereChemical ControlMachinary/Equipment00000040000044
1202/07/2020Finishing Cellstuff herePersonnel/PPEPersonnel/PPE00000040000044
1302/07/2020Flatworkstuff hereMachinary/EquipmentProcess Proceedure00000030000033
1413/07/2020Cuttingstuff hereProcess ProceedureSlip/Trip/Fall00000040000044
1502/07/2020Finishing Cellstuff hereHousekeepingVehicles/Transport00000010000011
1602/07/2020Flatworkstuff hereEnvironmentalTotal =00000032000003232
1706/07/2020Cuttingstuff hereVehicles/Transport
1802/07/2020Finishing Cellstuff hereFire Hazard
1902/07/2020Flatworkstuff herePersonnel/PPE
2013/07/2020Cuttingstuff hereMachinary/Equipment
2102/07/2020Finishing Cellstuff hereProcess Proceedure
2202/07/2020Flatworkstuff hereHousekeeping
2306/07/2020Cuttingstuff hereEnvironmental
2402/07/2020Finishing Cellstuff hereSlip/Trip/Fall
2502/07/2020Flatworkstuff hereFire Hazard
2613/07/2020Cuttingstuff herePersonnel/PPE
2702/07/2020Finishing Cellstuff hereMachinary/Equipment
2802/07/2020Flatworkstuff hereProcess Proceedure
2913/07/2020Warehousestuff hereHousekeeping
3002/07/2020officesstuff hereEnvironmental
3102/07/2020Gluingstuff hereSlip/Trip/Fall
3213/07/2020Flatworkstuff hereFire Hazard
3302/07/2020Reworkstuff herePersonnel/PPE
Sheet1
Cell Formulas
RangeFormula
U5U5=MONTH(1&LEFT(U6,3))
G7:R15G7=IF($F$3="All",SUMPRODUCT(--($D$2:$D$1000=$F7),--(MONTH($A$2:$A$1000)=G$5)),SUMPRODUCT(--($B$2:$B$1000=$F$3),--($D$2:$D$1000=$F7),--(MONTH($A$2:$A$1000)=G$5)))
S7:S15S7=SUM(G7:R7)
U16,G16:S16G16=SUM(G7:G15)
U7:U15U7=INDEX($G7:$R7,MATCH($U$5,$G$5:$R$5))
 

Attachments

  • pic1.jpg
    pic1.jpg
    58.3 KB · Views: 7
Last edited:
Upvote 0

Forum statistics

Threads
1,215,847
Messages
6,127,264
Members
449,372
Latest member
charlottedv

We've detected that you are using an adblocker.

We have a great community of people providing Excel help here, but the hosting costs are enormous. You can help keep this site running by allowing ads on MrExcel.com.
Allow Ads at MrExcel

Which adblocker are you using?

Disable AdBlock

Follow these easy steps to disable AdBlock

1)Click on the icon in the browser’s toolbar.
2)Click on the icon in the browser’s toolbar.
2)Click on the "Pause on this site" option.
Go back

Disable AdBlock Plus

Follow these easy steps to disable AdBlock Plus

1)Click on the icon in the browser’s toolbar.
2)Click on the toggle to disable it for "mrexcel.com".
Go back

Disable uBlock Origin

Follow these easy steps to disable uBlock Origin

1)Click on the icon in the browser’s toolbar.
2)Click on the "Power" button.
3)Click on the "Refresh" button.
Go back

Disable uBlock

Follow these easy steps to disable uBlock

1)Click on the icon in the browser’s toolbar.
2)Click on the "Power" button.
3)Click on the "Refresh" button.
Go back
Back
Top