ExcelCT
New Member
- Joined
- Feb 13, 2020
- Messages
- 10
- Office Version
- 365
- 2016
- 2013
- Platform
- Windows
- MacOS
- Web
Hello all.
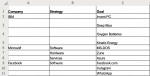
If anyone has used joined reports in Salesforce, you'll know the export output is limited to grouped, pre-formatted Excel sheets that are not (in Salesforce parlance) 'detailed reports'. For using pivot tables with these exports, this is a bit of a problem because there are not repeating rows and rather the data looks like below. The actual report is way more complicated, but I've made a sample of how the data looks. If with your help I can figure out how to get a working pivot table with this sample data, I'm confident I could handle the rest of the work.
About the data: This is the format it comes out of Salesforce. I can image some ways I could get my required output (see below) without using pivot tables - but I love pivot tables and would like to use them if possible. I know I could do some amount of "post processing" via macros or helper columns - and I may have to do that. I would like to keep post-processing to a minimum.
It's important to note that the strategy entries (or lack thereof) and the goals (or lack thereof) are independent of each other. That is the 'join' in Salesforce (in my example, the join is on Company). Thus each company can have 0 to n number of Strategies and 0 to n number of Goals. They have both. They may have neither. Obviously pivot table out of the box can't really deal with this format very well. As humans, it is easy to understand what I'm trying to get to, but not sure how to make a pivot table do this. I do have PowerPivot and have used it somewhat in the past but not an expert user of it. But if there is a PowerPivot-based solution, I could enact that.
Thanks in advance for your help.
-CT
 . But will look into that. Thanks!


