How not to graph blank cells

Mike L

New Member
Joined
Jul 10, 2002
Messages
18
Ok this is probably easy but I'm stumped...

How do I graph (scatter or line) a series of values that contain blank cells in the y data series, without them coming up as zero values on the graph.

If the y value is blank, I do not want this data point plotted at all.

Like I said probably really easy but I'm having trouble.

Thanks

-Mike
 
Thanks PaddyD -

I'm not really sure how to use the iserror function - if I refer it to a cell with #N/A it returns TRUE which I can then use conditional formating on to hide it (white txt). I actually need to do this to the cell itself, rather than another cell.

The trouble I have is that the same values that I have graphed need to be printed as a data table above the graph. At the moment the graph is good, but the #N/A's show up on the data table.

Any suggestions - the only other way around it that I see is to put the actual graph data (complete with #N/a's) outside the printable area of the page, and then construct a printable data table using conditinal formating and the ISERROR function. There must be an easier way (I hope!)

Thanks

-Mike
 
Upvote 0

Excel Facts

Difference between two dates
Secret function! Use =DATEDIF(A2,B2,"Y")&" years"&=DATEDIF(A2,B2,"YM")&" months"&=DATEDIF(A2,B2,"MD")&" days"
Mike,

ran a small test on the following data series in A1:D1

{1;#N/A;3;4}

where the #N/A was created by the following formula in cell B1

=IF(A1=1,#N/A,#N/A)

chart plotted without plumetting to zero, and the data table included in the chart had a blank where the #N/A would have been ??

Paddy
 
Upvote 0
Sorry Paddy,

my mistake - the problem that I have is that I have a page that consists of a data table (in your example this would be cells A1:D1, all nicely formated and ready to print) and a graph (again nicely formated for the boss!) underneath it that is generated from this data. The original problem was that the table looked great (all 'blank' formula results were hidden by conditional formating with white text) and the graph plumeted to zero.

Now the graph is great, but I have #N/A appearing in the cells of my table, with no apparent way of hiding them from the printout.

Cheers again

-Mike
 
Upvote 0
Paddy,

Is Mike a bit confused about the conditional formatting bit, perhaps.

Mike, if you conditionally format a cell in your data table as having white text, and copy the format to the whole data table, it should look ok.

To conditionally format, select conditional formatting from the format menu, select formula is from the drop down box, enter
=ISERROR(A1) (where A1 is the current cell), click on the format button abd select font color white.

HTH

Richard
 
Upvote 0
Yea...it was just me being confused in my mind...thanks Paddy and Richard - its all working sweet as.

Thanks heaps

-Mike
 
Upvote 0
For any other users that are still having this problem out there, I got around it by selecting Interpolated under the Chart Tab in Options, then individually selecting each line and telling it to be mapped on the secondary axis. This leaves a problem with one that must stay on the primary axis, so map an extra lot of data that is useless, and then select the line and delete it from the graph. That worked fine for me.

Best of luck!
 
Upvote 0
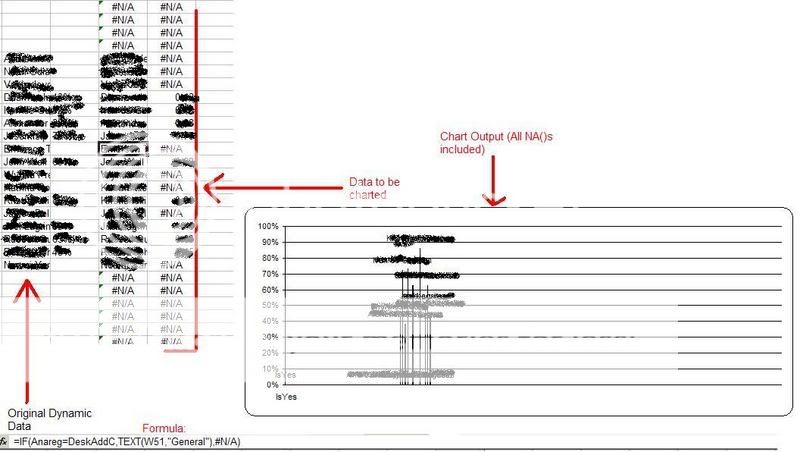
I am having this problem with a bar chart. NA() does not do the job.

I have about 70 cells, where there will always be some of which that are blank depending on user specification. This means I can not take the route of manually copying cells and leaving out the blanks. My empty cells do contain the following formulas:

Column 1
=IF(Anareg=DeskAddC,TEXT(Anais,"General"),NA())
Colunm 2
=IF(AnaFCRV="",NA(),IF(Anareg=DeskAddC,VALUE(AnaFCRV),NA()))

The deffinitions are referring to the original source data however DeskAddC refers to the criteria. This means if the source information (Amareg) does not match the criteria, the data will not be included in my graph.

Baring in mind this is a bar chart which is different to everyone elses problem (seems to be common resolutions for line graphs) im not sure but this may be why the resolutions dont work for me.
 
Upvote 0
There is a lot of confusion about this issue.

1. NA() or #N/A only is not plotted in a chart that uses markers, i.e., Line, XY, radar charts.

2. You can go crazy trying to use the same range as the source data for a chart and as a table for a report or for on-screen viewing. The best thing to do is keep the original data on a sheet somewhere, and make two tables linked to this data. The first is for charting, and has formulas that use =IF({something},NA(),A1). The second is for the display table, and uses =IF({something},"",A1). This way, you can format the table however it needs to be for the report, and if you have to insert rows or columns, it will not mess up the chart. You can also keep the #N/A values in the chart source data, so when you look at it, you don't have to try to remember why that cell looks blank, or jump into the CF settings.
 
Upvote 0
chartingproblem.jpg


For the perpose of corporate confidentiality, I have blanked out the values as these are irrelivant.
 
Upvote 0

Forum statistics

Threads
1,215,575
Messages
6,125,612
Members
449,238
Latest member
wcbyers

We've detected that you are using an adblocker.

We have a great community of people providing Excel help here, but the hosting costs are enormous. You can help keep this site running by allowing ads on MrExcel.com.
Allow Ads at MrExcel

Which adblocker are you using?

Disable AdBlock

Follow these easy steps to disable AdBlock

1)Click on the icon in the browser’s toolbar.
2)Click on the icon in the browser’s toolbar.
2)Click on the "Pause on this site" option.
Go back

Disable AdBlock Plus

Follow these easy steps to disable AdBlock Plus

1)Click on the icon in the browser’s toolbar.
2)Click on the toggle to disable it for "mrexcel.com".
Go back

Disable uBlock Origin

Follow these easy steps to disable uBlock Origin

1)Click on the icon in the browser’s toolbar.
2)Click on the "Power" button.
3)Click on the "Refresh" button.
Go back

Disable uBlock

Follow these easy steps to disable uBlock

1)Click on the icon in the browser’s toolbar.
2)Click on the "Power" button.
3)Click on the "Refresh" button.
Go back
Back
Top