Ok this is probably easy but I'm stumped...
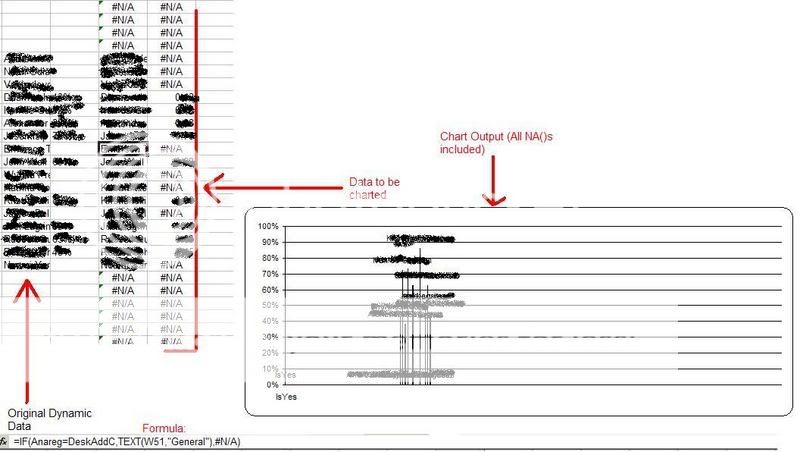
How do I graph (scatter or line) a series of values that contain blank cells in the y data series, without them coming up as zero values on the graph.
If the y value is blank, I do not want this data point plotted at all.
Like I said probably really easy but I'm having trouble.
Thanks
-Mike
How do I graph (scatter or line) a series of values that contain blank cells in the y data series, without them coming up as zero values on the graph.
If the y value is blank, I do not want this data point plotted at all.
Like I said probably really easy but I'm having trouble.
Thanks
-Mike