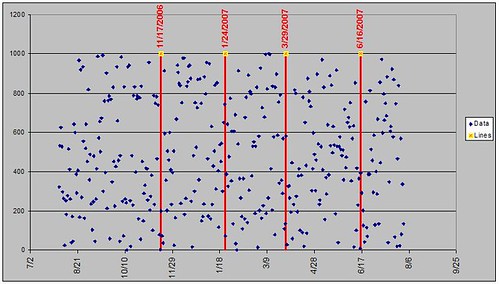
I am creating a basic line graph with an X and Y axis. My X axis consists of daily dates covering a one year period. I am trying to add to this graph vertical lines extending upward from the X axis for specific dates. For example, I have a graph that has an X axis covering the period from August 1, 2006 up to the current date. I would like to have a vertical line displaying on my graph for November 17, 2006, January 24, 2006, March 29, 2006 and June 16, 2006.
Can someone help with this?
Thanks in advance.
Glen
Can someone help with this?
Thanks in advance.
Glen