Add Entry/Exit points to OHLC chart

StanSz

Board Regular
Joined
Sep 18, 2004
Messages
199
I have an OHLC stock chart with candlesticks -- it works well.

Now, I would like to add occasional price entry and exit points to this same candlestock chart.

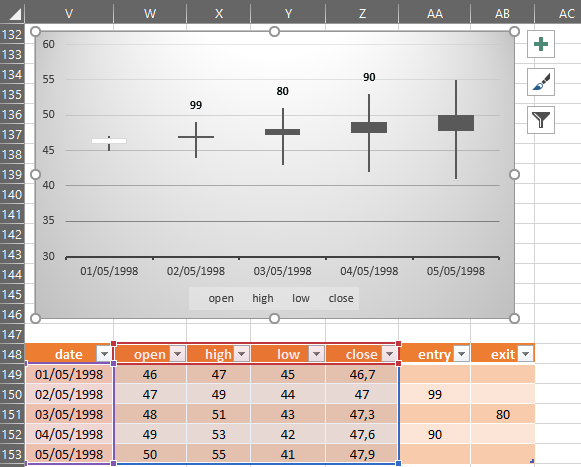
I have five columns of data, Date (for the labels), and then the OHLC prices.

I have added two additional columns for the price entry and exit points. These columns are empty except for the occasional price which appears whenever there is an entry or an exit indicated on a specific date.

I want to have these entry/exit points appear on the OHLC candlestick charts -- they would end up over the daily date candlestick for whatever date the entry or exit occurs.

By changing the chart type to Line, I can get these entry/exit points to appear on the chart, (when I add an Entry and an Exit series), but in doing so I loose seeing the candlesticks, and I end up with just a line graph. I can't switch back to the OHLC type since I get error messages, and I need to delete the two entry/exit series to return to the candlesticks.

Is there a way for me to keep the candlesticks and yet have the entry/exit points appear. ??

Thanks

Stan
 

Excel Facts

Highlight Duplicates
Home, Conditional Formatting, Highlight Cells, Duplicate records, OK to add pink formatting to any duplicates in selected range.
The example below adds labels from one additional column. Can you have entry and exit prices on the same date or it will always be a single value per date?

Code:
[FONT=Courier New][COLOR=#000000] 
Sub Candle()
Dim c As Chart, a, r As Range, i%, s As Series
Set r = [ad149]                                 ' cell where entry/exit starts
Set c = ActiveChart
Set s = c.SeriesCollection("high")              ' the high prices data
a = s.XValues
s.ApplyDataLabels
s.DataLabels.Position = xlLabelPositionAbove
For i = LBound(a) To UBound(a)
    Select Case Len(r)
        Case 0
            s.Points(i).DataLabel.Delete
        Case Is > 0
            s.Points(i).DataLabel.Format.TextFrame2.TextRange.Characters.Text = r
    End Select
    Set r = r.Offset(1)
Next
End Sub<strike></strike>
[/COLOR][/FONT]
<strike></strike>
 
Last edited:
Upvote 0
The example below adds labels from one additional column. Can you have entry and exit prices on the same date or it will always be a single value per date?

Code:
[FONT=Courier New][COLOR=#000000] 
Sub Candle()
Dim c As Chart, a, r As Range, i%, s As Series
Set r = [ad149]                                 ' cell where entry/exit starts
Set c = ActiveChart
Set s = c.SeriesCollection("high")              ' the high prices data
a = s.XValues
s.ApplyDataLabels
s.DataLabels.Position = xlLabelPositionAbove
For i = LBound(a) To UBound(a)
    Select Case Len(r)
        Case 0
            s.Points(i).DataLabel.Delete
        Case Is > 0
            s.Points(i).DataLabel.Format.TextFrame2.TextRange.Characters.Text = r
    End Select
    Set r = r.Offset(1)
Next
End Sub<strike></strike>
[/COLOR][/FONT]
<strike></strike>

Thank you for your reply. There will only be either an entry or an exit price on one day - not both. This example is more involved than I'm usually dealing with. I won't have a chance to play with it until the weekend. Thank you again
 
Upvote 0
o The version below works with the two additional columns, and was tested with Excel 2007. What version are you using?
o If you have trouble testing the code, I can provide detailed explanations or a link to my workbook.

Code:
Sub Candle()
Dim c As Chart, a, r As Range, i%, s As Series, v
Set r = [I121]                                 ' cell where entry/exit starts
Set c = ActiveChart
Set s = c.SeriesCollection("high")              ' the high prices data
a = s.XValues
s.ApplyDataLabels
s.DataLabels.Position = xlLabelPositionAbove
For i = LBound(a) To UBound(a)
    Select Case Len(r) + Len(r.Offset(, 1))
        Case 0
            s.Points(i).DataLabel.Delete
        Case Is > 0
            If Len(r) > 0 Then
                v = r.Value
            Else
                v = r.Offset(, 1)
            End If
            s.Points(i).DataLabel.Text = v
    End Select
    Set r = r.Offset(1)
Next
End Sub
Thank you for offering an explanation of the working of the code -- this would be more helpful to me than access to your workbook. I am working with Excel 2002

If it is of any use to you, the Date is in Column V; Open, High, Low, Close in Columns W, X, Y, Z; and the Entry and Exit prices are in Column AA and AB. But, of course I can move these anywhere else if that's preferable.
 
Upvote 0
  • That is an old version, the nearest thing I have is 2007.
  • Before running the code, activate the chart.
  • Note the table column labeled high, mentioned on the code.

UHqAq7o.png


Code:
Sub Candle()                                    ' this version tested with Excel 2016
Dim a, r As Range, i%, s As Series
Set r = [aa149]                                 ' cell where entry/exit starts
Set s = ActiveChart.SeriesCollection("high")    ' the high prices data
a = s.XValues
s.ApplyDataLabels
s.DataLabels.Position = xlLabelPositionAbove
s.DataLabels.Format.TextFrame2.TextRange.Font.Fill.ForeColor.RGB = RGB(12, 21, 22)
For i = LBound(a) To UBound(a)
    Select Case Len(r) + Len(r.Offset(, 1))
        Case 0
            s.Points(i).DataLabel.Delete
        Case Is > 0
            If Len(r) > 0 Then
                s.Points(i).DataLabel.Text = r
            Else
                s.Points(i).DataLabel.Text = r.Offset(, 1)
            End If
    End Select
    Set r = r.Offset(1)
Next
End Sub

Dear worf,

Well I finally had time to work with your VBA code for adding Entry/Exit points to an OHLC chart.

My initial trials weren't succussful and I kept getting error messages. I don't know enough to know whether it was just my messing up your code with my adjustments, or whether it was a difference between Excel 2002 and Excel 2007 and later. On one attempt I did get a result similar to what you had gotten, with the entry and exit prices above the corresponding candlestick -- BUT I was getting prices above every single candlestick.

During my efforts I came across another chart OHLC chart online that had exactly what I wanted -- entry and exit indicators with the candlesticks. So, I decided to attempt replacing the data in that chart with my data. I was successful and so I now have my desired chart. I've tried to include a small image of my chart so you can see what I ended up with, but I can't figure out how to do that.

What seems to be the key to getting the entry/exit prices to display is to use the Secondary xlValue Axes, and have the Scale of both axes be the same. That way the entry/exit markers from the separate columns get plotted on the same scale as the regular OHLC prices.

Regarding my 'old' version of Excel: I have Excel 2002 and have been very happy with it. I can't think of anything that I wanted to do that I was unable to do. When Excel 2007 appeared I decided not to get it, one because of the 'blankety-blank' ribbon replacing the tool bars, and also because of some issue with Named Ranges that I don't remember at the moment. I do volunteer work at a local Arboretum and do Excel projects for them, but most of my time is spent in looking for Excel items instead of their location being immediately known if I had the old toolbars back.

Thank you for your time and effort in helping. It is greatly appreciated.

Stan
 
Upvote 0
Hi Stan

There are several ways to skin a cat, I am glad you came to a solution.
To include an image, upload it to a hosting site like Imgur and paste the link here.
 
Last edited:
Upvote 0
This is a follow-up after a PM from @jetpack, regarding this thread.
Features of the example below:


  • Runs automatically when the sheet is activated. Can be adapted to perform on multiple charts.
  • Text in data labels is formatted.
  • Defines data label positioning.
  • Applies to several chart types, not only candlestick.

Code:
'Sheet Module

Private Sub Worksheet_Activate()
Dim d As DataLabels, ch As Chart
Set ch = Me.ChartObjects("chart 4").Chart           ' your chart name here
ch.FullSeriesCollection(2).HasDataLabels = 1
Set d = ch.FullSeriesCollection(2).DataLabels       ' your series index here
d.Position = xlLabelPositionAbove
With d.Format.TextFrame2.TextRange.Font.Fill
    .Visible = msoTrue
    .ForeColor.ObjectThemeColor = msoThemeColorAccent2
    .ForeColor.TintAndShade = 0.1
    .ForeColor.Brightness = -0.3
    .Transparency = 0.2
    .Solid
End With
d.Format.TextFrame2.TextRange.Font.Size = 14
End Sub
 
Upvote 0

Forum statistics

Threads
1,215,465
Messages
6,124,978
Members
449,200
Latest member
Jamil ahmed

We've detected that you are using an adblocker.

We have a great community of people providing Excel help here, but the hosting costs are enormous. You can help keep this site running by allowing ads on MrExcel.com.
Allow Ads at MrExcel

Which adblocker are you using?

Disable AdBlock

Follow these easy steps to disable AdBlock

1)Click on the icon in the browser’s toolbar.
2)Click on the icon in the browser’s toolbar.
2)Click on the "Pause on this site" option.
Go back

Disable AdBlock Plus

Follow these easy steps to disable AdBlock Plus

1)Click on the icon in the browser’s toolbar.
2)Click on the toggle to disable it for "mrexcel.com".
Go back

Disable uBlock Origin

Follow these easy steps to disable uBlock Origin

1)Click on the icon in the browser’s toolbar.
2)Click on the "Power" button.
3)Click on the "Refresh" button.
Go back

Disable uBlock

Follow these easy steps to disable uBlock

1)Click on the icon in the browser’s toolbar.
2)Click on the "Power" button.
3)Click on the "Refresh" button.
Go back
Back
Top